Amid a prolonged bearish trend, Bitcoin [BTC] fell to a two-week low of $62,696 before slightly rebounding. At press time, BTC traded at $63,376, down 3.49% on the daily charts, adding to its weekly losses.
With Bitcoin on a sustained decline, analysts have projected further losses, citing Reserve Risk Indicators.
A continued downtrend ahead?
According to Alphractal, reserve risk indicators have continued to decline alongside dropping prices.
Reserve Risk and VOCDD/MVOCDD have both turned downward, signaling a weakening alignment between price trends and long‑term holder convictions.


Source: Alphractal
When reserve risk stays elevated, it typically signals increased economic activity from older coins, pointing to long‑term holder (LTH) distribution.
Looking back at previous cycles, these indicators have triggered four sell signals since 2024, each followed by a significant decline in BTC’s price. If LTHs increase their spending during this current period of weakness, history suggests the pattern could repeat.
Is this cycle any different?
While long-term holders have been quietly exiting the market, the continued price decline has left short-term holders demotivated to sell.
Looking at the Short-term Sell Side Risk Ratio, this metric has declined through February, especially since BTC fell below $70k. A decline in sell-side risk for the cohort means this group is highly unlikely to sell at the prevailing market conditions.

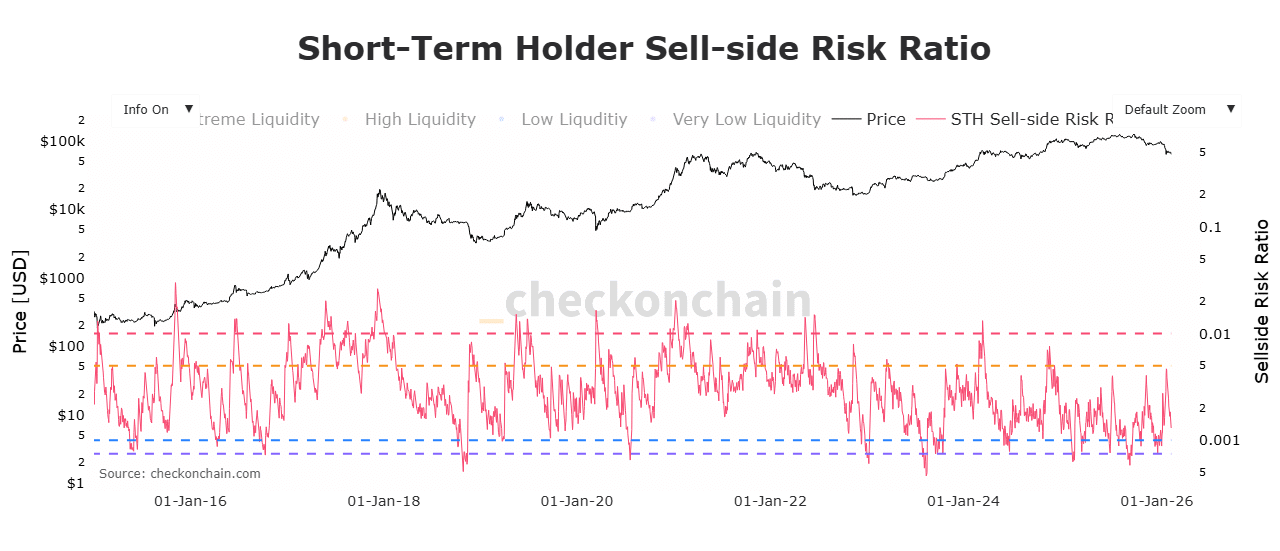
Source: Checkonchain
With short-term holders sitting at significant losses, they currently have no incentive to sell, offering minimal relief to the market.
Importantly, Bitcoin’s recent dip has made it more accessible to small‑scale investors, who have seized the opportunity to accumulate. Shrimp, Fish, and Crab cohorts have all added more BTC than they sold.

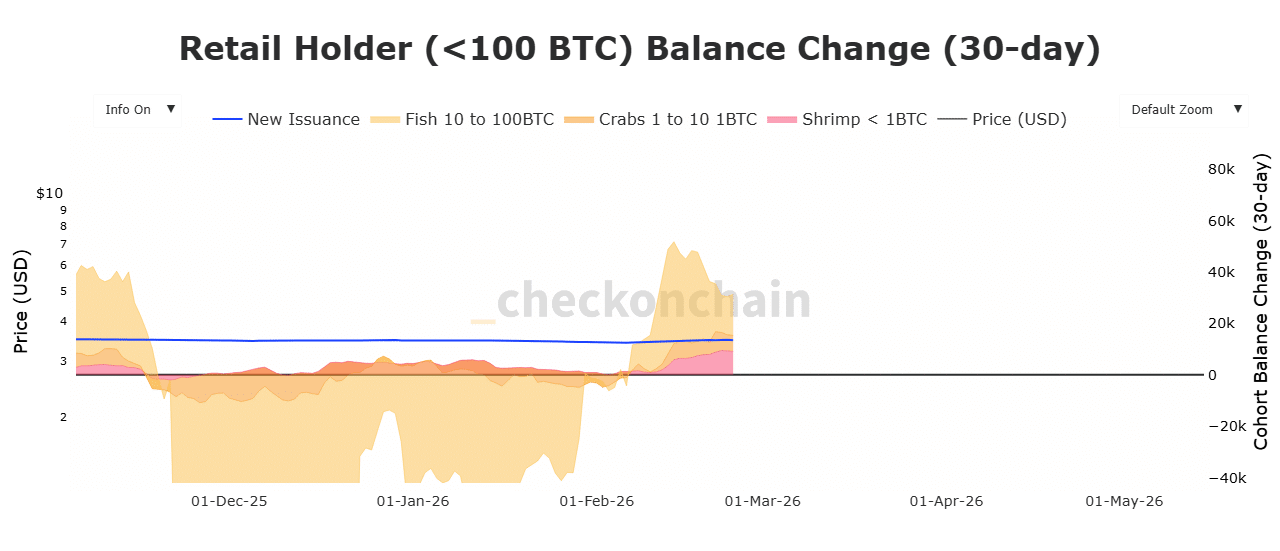
Source: Checkonchain
As a result, their balance changes rose to 9.1k BTC, 16k BTC, and 6.2k BTC, respectively, signaling steady accumulation. With small traders buying and short‑term holders showing little incentive to sell, demand appears strong enough to prevent a sharp price crash.
Therefore, even though Reserve Risk indicators signaled a potential market drop, these two sit on the demand side, ready to absorb pressure.
In doing so, BTC could avoid a significant drop, reclaim $68k, and target $72k by the end of the month, according to the Future Grand Trend Indicator.
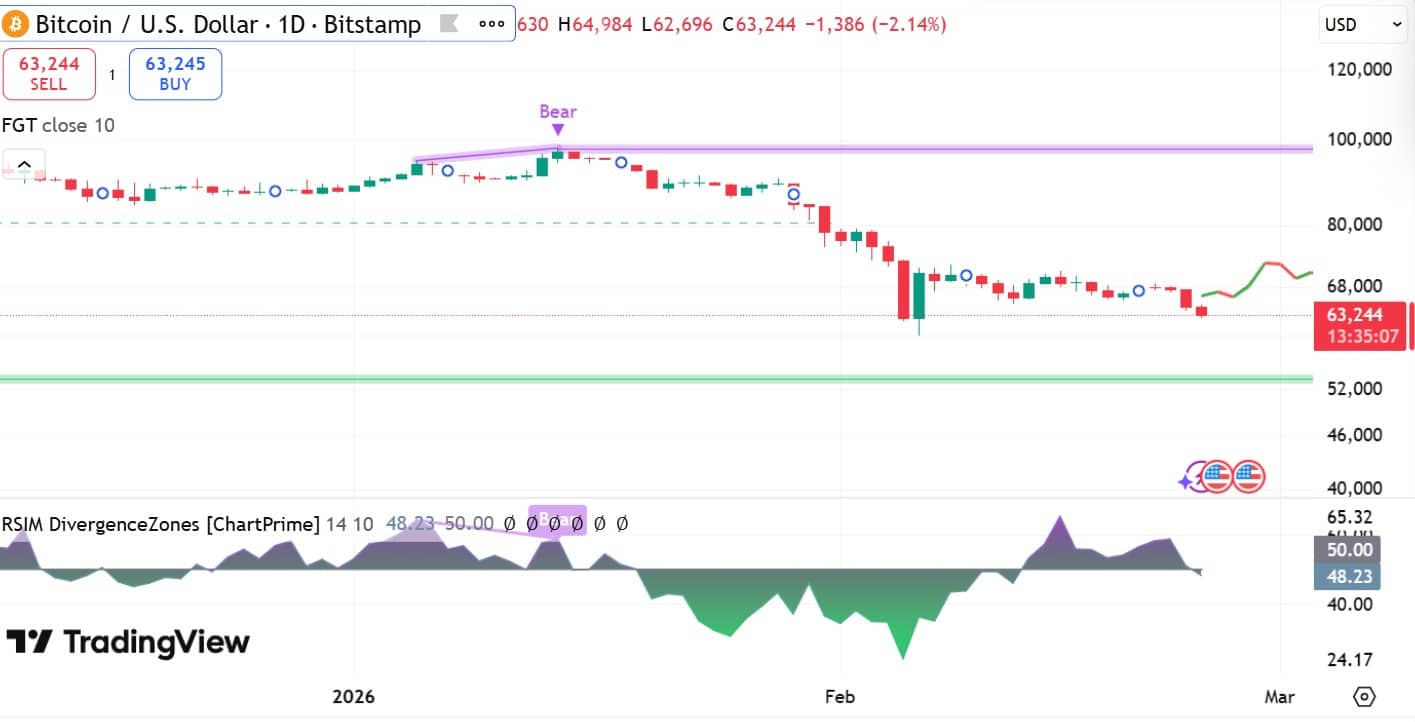
Source: Checkonchain
However, if the historical pattern holds, Bitcoin could breach the $60k support level, especially with the RSIM Divergence Zone flashing a bearish signal.
Final Summary
- Bitcoin Reserve Risk Indicators continue to decline, suggesting weakened alignment between price and LTH convictions.
- STH and retail traders provide minimal relief, avoiding a sharp price crash.
Source: https://ambcrypto.com/bitcoin-flashes-4-sell-signals-since-2024-is-history-repeating/