Bitcoin price analysis is on the bullish side today. Bulls have recovered a good range from $22,688 to 23,722 today. The bullish momentum that started yesterday helped in elevating the price from $22,688 to the current price level. Today a high swing toward $23,089 was also observed at one point. BTC/USD has been gaining traction with a major push above the $23,000 level which has been a major aim for the bulls that held support levels from $22,688. Now, with price correction, the range has gone up to $23,722 approximately.
BTC bulls are eyeing the next target of $23,500, however, there will be a lot of resistance to breaking before the price can reach the next level. The current range is quite narrow and BTC needs more momentum to break out of it. Today’s market cap is currently sitting at $444 billion and the 24-hour trading volume is $33 billion, which indicates strong buying pressure in the market.
Bitcoin price analysis 1-day price chart: BTC/USD bulls gain 2.05 percent
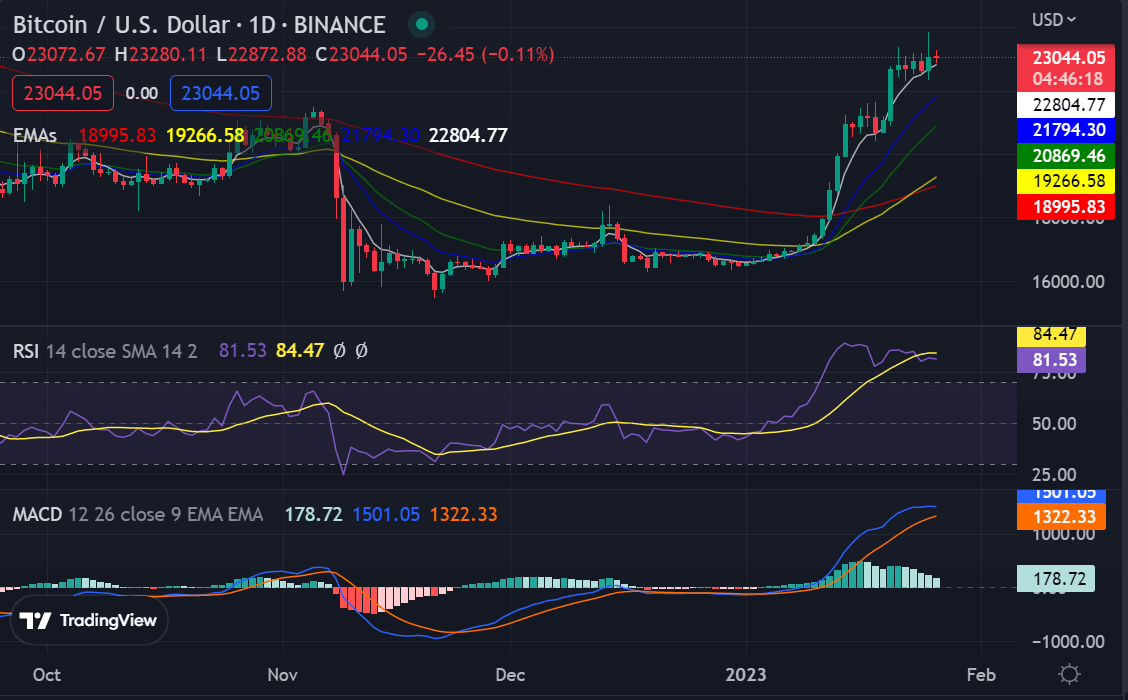
The 1-day price chart for Bitcoin price analysis shows that the present bullish momentum has yielded good results as BTC is now trading at $23,039 at the time of writing, as today is the highest range for the past 24 hours. Since the recovery from $22,688 to its current price level, BTC has seen a 2.05% increase in value. Despite the downtrend from yesterday, the bulls have been able to gain back the lost ground and have pushed BTC/USD above the $23,000 level.

Bitcoin’s technical analysis indicates BTC is trading well above the 100-day EMA, which is a reversal pattern. Additionally, the 50-day EMA is trending above its 100-day counterpart for the last 24 hours. The RSI is at 84.47, indicating the bullish momentum will continue in the short term. The MACD shows that the price is in the bullish zone, and the histogram is rising, which suggests that the uptrend of BTC/USD will continue for some more time. The 50-SMA and 200-SMA lines have been trending higher, indicating a strong bullish trend in the market.
Bitcoin price analysis: Bullish momentum shows continuous strength
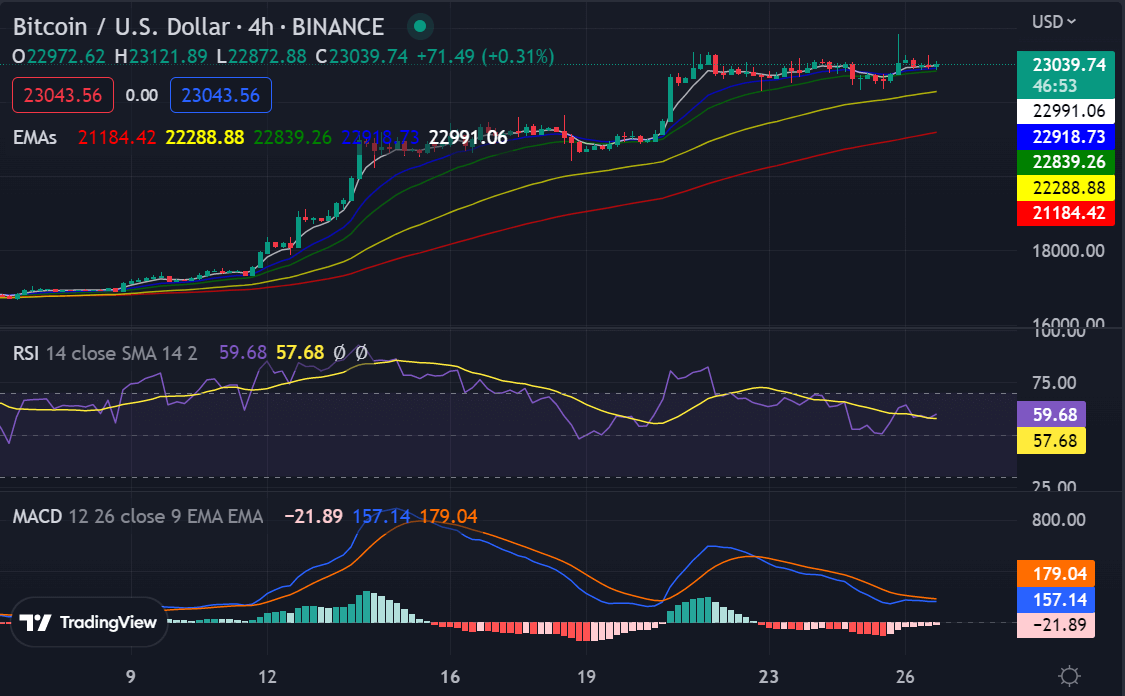
The 4-hour Bitcoin price analysis shows that the price has been rising from the very start of today’s session, with a high of $23,089. The 4-hour price chart also shows that the bulls have been in control over the past 24 hours and are expected to remain so for some time. The ascending triangle pattern has been forming in the chart and is expected to move towards a breakout soon.

Looking at 4-hour technical indicators, The RSI is also above 50 levels, indicating that the bulls are still in charge of the market. The 50-day MA and 200-day MA lines are trending higher, indicating a strong bullish trend. The EMA lines are trending higher in the chart, indicating that there is still room for further upside potential. The 9-EMA line is also trending above the 20-EMA line, indicating that the bulls are still firmly in control.
Bitcoin price analysis conclusion
Overall, Bitcoin price analysis indicates that BTC/USD could see a further rise toward $23,500 in the next few days. The bullish momentum will remain intact if bulls manage to hold above the $23,000 level. Bulls will also have to defend the $22,688 level if they want to sustain the bullish trend. The next level of resistance is seen at $23,500 and any break above this could result in a significant surge in prices over the coming days.
While waiting for Bitcoin to move further, see our Price Predictions on XDC, Cardano, and Curve
Source: https://www.cryptopolitan.com/bitcoin-price-analysis-2023-01-26/