Bitcoin Analysis
Bullish BTC market participants drove the price higher for a second consecutive daily session on Tuesday and when the day’s candle was printed, BTC’s price was +$230.1.
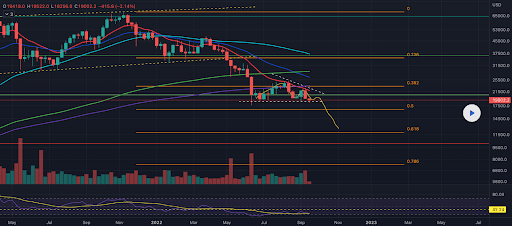
The BTC/USD 1W chart below from Broke0Millionare is the first chart we’re delving into for this Wednesday. BTC’s price is trading between the 0.5 fibonacci level [$16,643.3] and the 0.382 fib level [$23,282.9], at the time of writing.
Bullish BTC market participants want to regain the most important historical level of inflection on BTC’s chart at $19,891 and need to regain the 0.382 fib level following that level to continue momentum to the upside.
BTC bulls couldn’t send BTC’s price above that level on their most recent attempt. If they succeed in eclipsing the 0.382 fib level the next target to the upside is 0.236 [$35,153.9] followed by a full retracement at 0 [$68,797.4] on the Bitfinex chart.
At variance with bullish BTC traders are bearish ones that are still short the world’s most popular digital asset. Bearish BTC traders are taking aim at pushing BTC’s price below the 0.5 fib level with targets after that level of 0.618 [$11,897.1], and [$7,413.].
The Fear and Greed Index is 23 Extreme Fear and is +1 from yesterday’s reading of 22 Extreme Fear.

Bitcoin’s Moving Averages: 5-Day [$16,723.17], 20-Day [$19,211.12], 50-Day [$19,462.46], 100-Day [$20,607.32], 200-Day [$28,318.00], Year to Date [$29,809.03].
BTC’s 24 hour price range is $16,527.7-$17,134.7 and its 7 day price range is $15,742.44-$18,595.48. Bitcoin’s 52 week price range is $15,603.-$63,562.
The price of Bitcoin on this date last year was $60,124.
The average price of BTC for the last 30 days is $19,286.6 and its -12.5% over the same duration.
Bitcoin’s price [+1.38%] closed its daily candle worth $16,847 and in green figures for a second day in a row.
Ethereum Analysis
Ether’s price also climbed higher for a second straight trading session on Tuesday and finished the day +$10.83.
The second chart we’re dissecting today is the ETH/USD 4HR chart below by desmondlzw. Those longing the Ether market were able to stave off the bearish pursuit of a trip back to triple figures over the last 48 hours but have a lot of work left to regain ETH’s former ATH of $1,448 from 2018.
The optimistic traders that see upside firstly on the ETH market have targets of the 61.80% fib level [$1,376.03] and a full retracement at 0 [$1,677.00] to the upside.
Contrariwise, bearish ETH traders are aiming at a retest of the 100.00% fib level [$1,190.00] followed by a test of the last level of defense for bulls above triple figures at the 127.20% fibonacci level [$1,057.54].

Ether’s Moving Averages: 5-Day [$1,237.99], 20-Day [$1,414.39], 50-Day [$1,406.75], 100-Day [$1,465.64], 200-Day [$1,971.63], Year to Date [$2,095.52].
ETH’s 24 hour price range is $1,234.01-$1,291 and its 7 day price range is $1,095.18-$1,333.07. Ether’s 52 week price range is $883.62-$4,878.
The price of ETH on this date in 2021 was $4,208.02.
The average price of ETH for the last 30 days is $1,404.18 and its -1.57% over the same stretch.
Ether’s price [+0.87%] closed its daily trading session on Tuesday worth $1,253.46.
Crypto analysis: Ripple (XRP)
Ripple’s [XRP] price finished up Tuesday’s daily trading session +$0.014.
The XRP/USD 4HR chart from DilbarKhakh shows the most integral levels to control in the interim for XRP market participants. At the time of writing, XRP’s price is trading between the 62.00% fib level [$0.3504] and 0.00% fib level [$0.4000].
The overhead targets on XRP in the short-term are 0.00%, -27.00% [$0.4216], -62.00% [$0.4496], -100.00% [$0.4800], and -127.20% [$0.5017].
The targets to the downside on XRP are 62.00%, 70.50% [$0.3436], 79.00% [$0.3368], 88.60% [$0.3291], 100.00% [$0.3200], and the 127.20% fibonacci level [$0.5017].
Ripple’s 24 hour price range is $0.366-$0.399- and its 7 day price range is $0.327-$0.408. XRP’s 52 week price range is $0.2876-$1.17.
Ripple’s price on this date last year was $1.08.
The average price of XRP over the last 30 days is $0.445 and its -18.47% over the same interval.
XRP’s price [+3.72%] closed its daily trading session worth $0.39060 on Tuesday and Ripple’s also strung together back to back positive days.
Source: https://en.cryptonomist.ch/2022/11/16/crypto-price-analyses-bitcoin-ethereum-ripple-xrp/

