Bitcoin Analysis
Bitcoin’s price sold-off to lower prices on Tuesday and concluded its daily session -$55.
The first chart we’re analyzing today is the BTC/USD 1D chart below by LevRidge. BTC’s price is trading between the 1 fibonacci level [$18,914.6] and 0.886 [$20,287.2], at the time of writing.
Bullish traders were able to successfully backtest and close above a critical level of inflection [$19,891] on Tuesday. Bullish traders are now aiming to crack overhead resistance levels at 0.886, 0.786 [$21,491.3], and 0.618 [$21,491.3].
Conversely, the targets of bearish traders to the downside of the chart are the 1 fib level followed by 1.13 [$17,349.3], and 1.27 [$15,663.6].
Bitcoin’s Moving Averages: 5-Day [$19,582.51], 20-Day [$21,999.57], 50-Day [$28,103.46], 100-Day [$34,837.15], 200-Day [$42,941.32], Year to Date [$36,392.64.
The Fear and Greed Index is 18 Extreme Fear and is -1 from Tuesday’s reading of 19 Extreme Fear.

BTC’s 24 hour price range is $19,287-$20,736 and its 7 day price range is $18,817-$20,736. Bitcoin’s 52 week price range is $17,611-$69,044.
The price of Bitcoin on this date last year was $34,130.
The average price of BTC for the last 30 days is $22,883.6 and its -34.1% over the same time frame.
Bitcoin’s price [-0.27%] closed its daily candle worth $20,169 and in red figures after finishing the prior two days in positive figures.
Ethereum Analysis
Ether’s price posted a red candle as well on Tuesday and sellers broke-up three consecutive days of green price action. ETH’s price finished Tuesday’s daily session -$17.24.
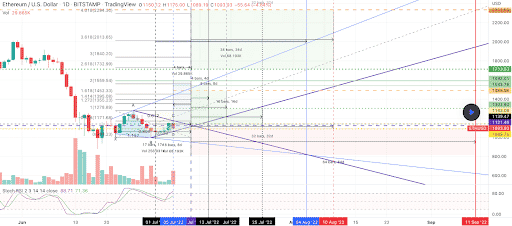
Today’s second chart of emphasis is the ETH/USD 1D chart below by otwa2113. ETH’s price is trading between 0 [$998.23] and 0.618 [$1,171.68], at the time of writing.
If BTC can rally the macro crypto market to higher prices, bullish ETH traders will first need to regain the 0.618 fib level to start their rally. The secondary target of bulls is 1 [$1,278.89] with a third target of 1.272 [$1,355.23].
Bearish traders have been controlling ETH’s price for the majority of 2022. The aim of bears is to continue their momentum and send ETH’s price back below the $1k level and then below the 0 fibonacci level next. If they’re successful at the level, the next level of strong support could be all of the way down between the $400-$500 range.
Ether’s Moving Averages: 5-Day [$1,087.66], 20-Day [$1,226.08], 50-Day [$1,805.41], 100-Day [$2,379.06], 200-Day [$3,056.21], Year to Date [$2,534.53].
ETH’s 24 hour price range is $1,076.34-$1,174.9 and its 7 day price range is 1,010.15-$1,174.9. Ether’s 52 week price range is $883.62-$4,878.
The price of ETH on this date in 2021 was $2,310.43.
The average price of ETH for the last 30 days is $1,280.4 and its -38.94 over the same duration.
Ether’s price [-1.50%] closed its daily candle on Tuesday worth $1,134.03.
Vechain Analysis
Vechain’s price was the worst performer of the lot being analyzed today and when traders settled up on Tuesday VET was -$0.0013.
The third chart we’re looking at today is the VET/USD 1W chart below from entertheroach. VET’s price is trading between the 78.60% fib level [$0.018] and 61.80% fib level [$0.032], at the time of writing.
Traders expecting upside over the short-term are eyeing the 61.80% fib level with the next target of 50.00% [$0.049] and a third target of 38.20% [$0.074].
Bearish Vechain market participants have driven VET’s price down by 92% since its all-time high of $0.28 made on April 19th, 2021. The targets for bearish VET traders are 78.60%, and a return to test the $0.01 level.
Vechain’s Moving Averages: 5-Day [$0.022], 20-Day [$0.024], 50-Day [$0.031], 100-Day [$0.044], 200-Day [$0.072], Year to Date [$0.049].
Vechain’s 24 hour price range is $0.021-$0.023 and its 7 day price range is $0.021-$0.023. VET’s 52 week price range is $0.02-$0.235.
Vechain’s price on this date last year was $0.084.
The average price of VET over the last 30 days is $0.025 and its -26.88% over the same timespan.
Vechain’s price [-2.40%] closed its daily candle on Tuesday worth $0.022 and in red figures for the first time in four days.
Source: https://en.cryptonomist.ch/2022/07/06/bitcoin-20k-ethereum-1-1k-vechain-price-analyses/


