The crypto market is down today, April 13, after President Trump announced that the US will block the Strait of Hormuz. In a contrasting performance, the US dollar index (DXY) has surged because the US has less exposure to oil disruptions caused by the closure. A forecast of Bitcoin and Ethereum price performance now signals that the dip may intensify if the sentiment does not change.
US Dollar Index Surges Amid Hormuz Blockade
Data from MarketWatch shows that the US dollar index has recorded a slight uptick and was up 0.33% in 24 hours to 98.98 at press time. The DXY usually assesses the strength of the dollar compared to other global currencies.
At press time, the dollar had gained 0.26% against the euro, while the Japanese yen had dropped by 0.24% against the dollar. This performance comes as markets brace for energy disruptions in Europe and Asia due to Trump’s announcement that the US would close the Strait of Hormuz to prevent Iran from collecting toll fees.
A surge in the US dollar index is usually bearish for the Bitcoin and Ethereum price forecast. This is because traders might turn to the USD as a safe haven and abandon risk assets.
The surging dollar value also comes amid a surge in US inflation levels, which has reduced the odds of interest rate cuts by the Federal Reserve. This is also bullish for the DXY, but bearish for BTC, ETH, and other crypto assets.
Bitcoin Price Forecast as Key Resistance Fails to Break
Bitcoin is facing a test at the resistance level of $73,165. Each time the price has tested this resistance level since early February, it has faced rejection. The most recent happened on April 12, where a rally to this resistance level triggered a decline in BTC price to around $70K.
Bitcoin’s failure to overcome this resistance and the drop that ensues has led to the formation of two rounding bottom patterns. This is a bullish pattern that often signals that an upward reversal is possible. If the price can move above this resistance, it could trigger a 12% rally to around $81,000.
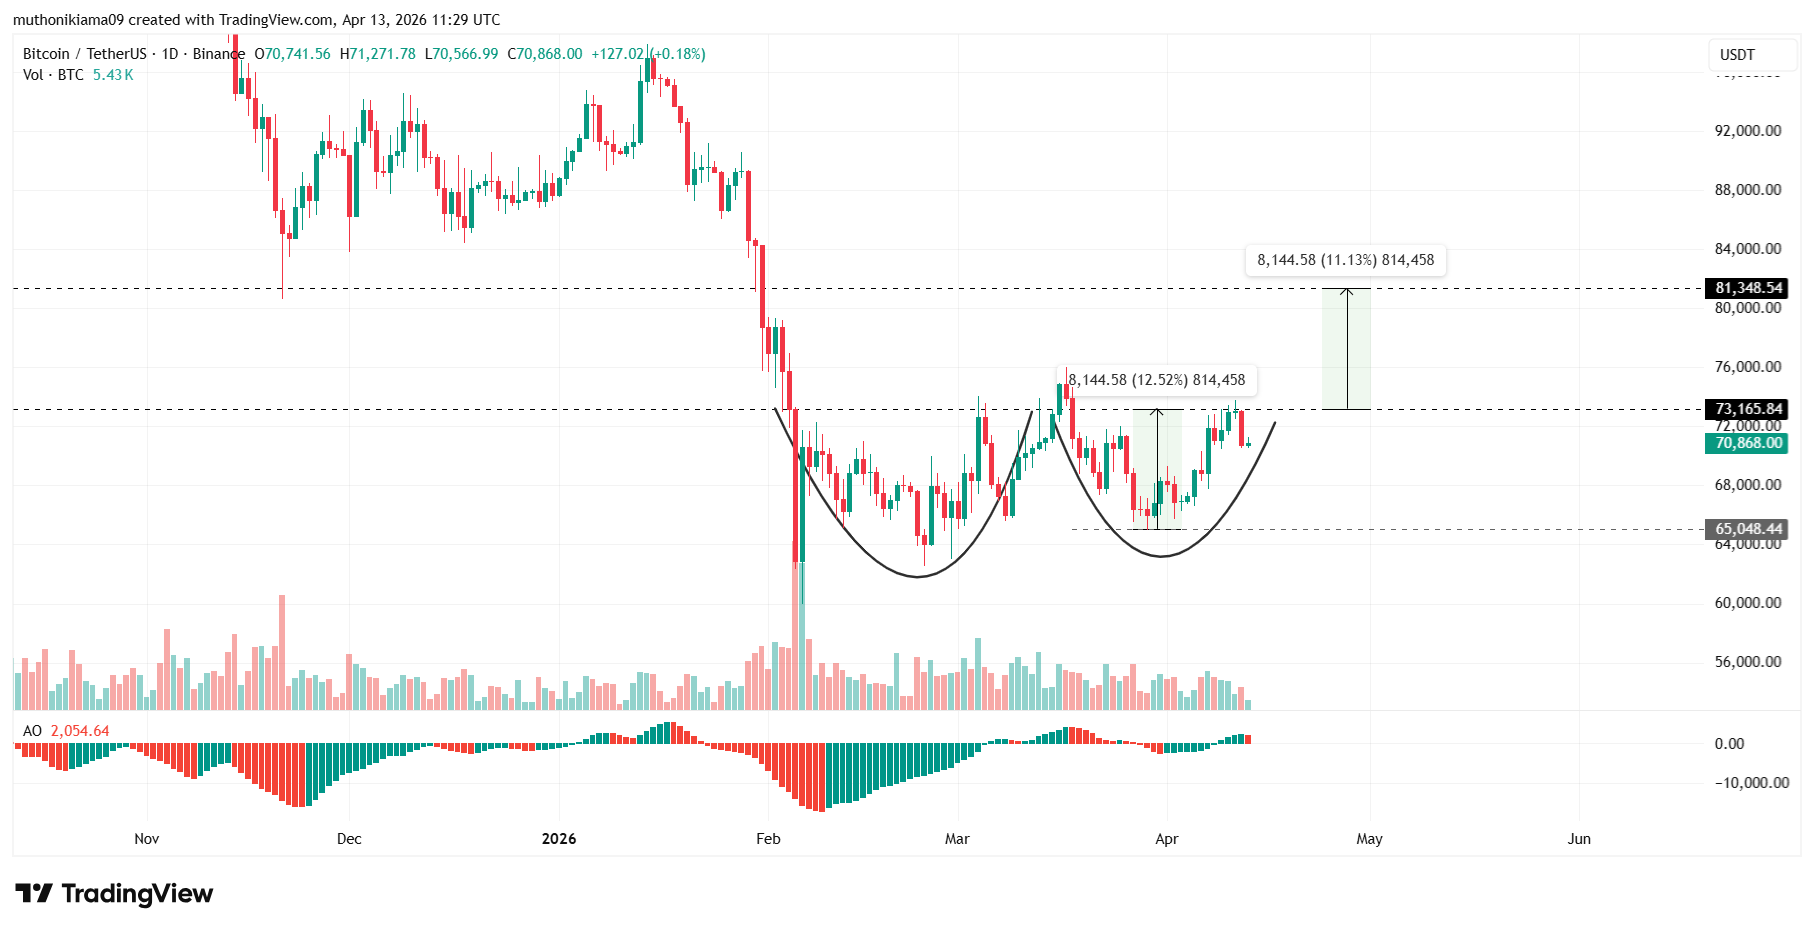

However, the AO histogram bars have turned red to indicate that the momentum is turning bearish since bulls failed to push the price above this resistance. A continuation of this downtrend below the support level at $65,000 will invalidate the rounding bottom’s bullish outlook on the long-term Bitcoin price prediction.
Ethereum Price Forecast as RSI Warns of Potential Drop
As the US dollar strengthens, the Ethereum price forecast appears grim due to a looming bearish crossover of the Relative Strength Index (RSI) line below the signal line. If this crossover happens, it will indicate a loss in the buying pressure as sellers take charge and drive potential dips.
At the same time, ETH price has also dropped below the midline of an ascending parallel channel. This is also a sign of a failing uptrend, and unless buyers return to the market, ETH may lose support at the channel’s lower trendline.
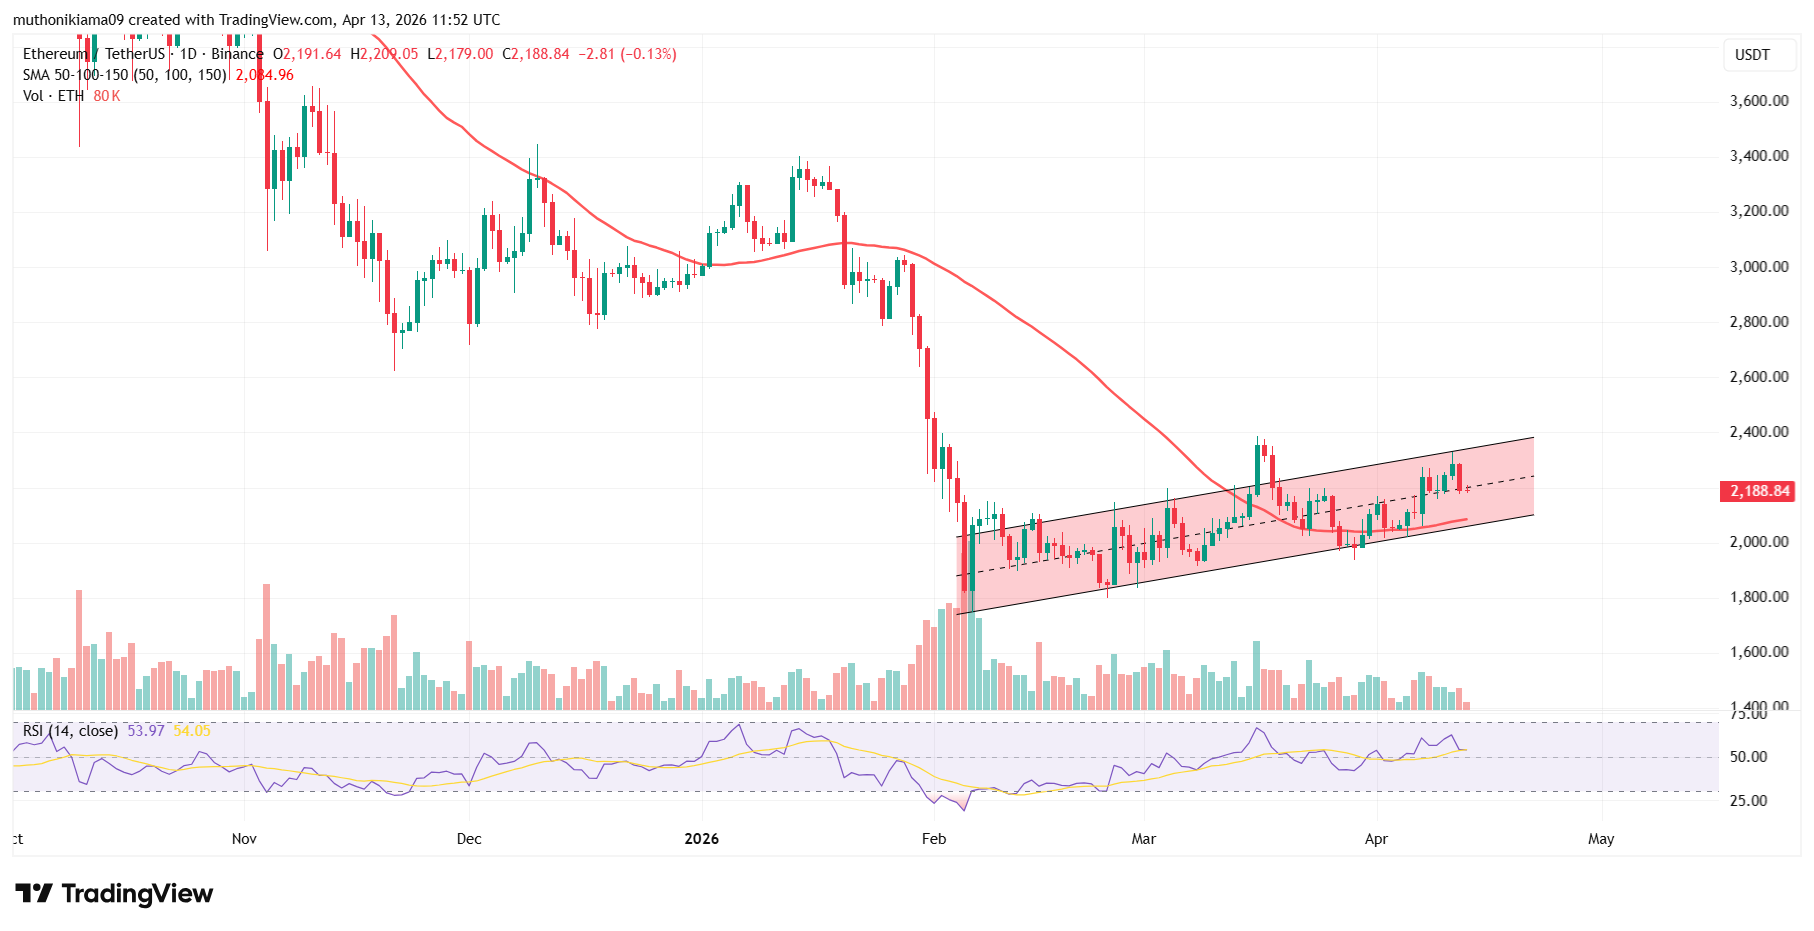

The key level to watch in the long-term Ethereum price prediction that could determine the next trajectory is the 50-day SMA level at $2,084. If ETH drops below this level and makes several closes below it, it might trigger a crash