Bitcoin’s [BTC] recent push toward $72,000 may therefore reflect a temporary move higher, one that risks trapping overly aggressive long traders.
In derivatives markets, positioning has turned notably bullish. The OI-Weighted Funding Rate has climbed to 0.0054%, marking its most optimistic level since the 23rd of February.
This suggests that a significant share of Bitcoin’s $50.64 billion in Open Interest is concentrated in long positions.
Under typical market conditions, such positioning would reinforce a bullish outlook. In the current context, however, it raises the risk of overcrowding, where excessive long exposure leaves the market vulnerable to a reversal.
A familiar setup pointing to a trap
Data from a CryptoQuant chart, published by a pseudonymous analyst tracking Bitcoin’s supply-demand dynamics using price and volume indicators, points to a recurring imbalance.
Similar structures appeared ahead of the October 2024 rally to $109,588 and the April 2026 rally to $126,199, identified as Zone 1 and Zone 2. In both cases, the imbalance temporarily eased before price continuation.
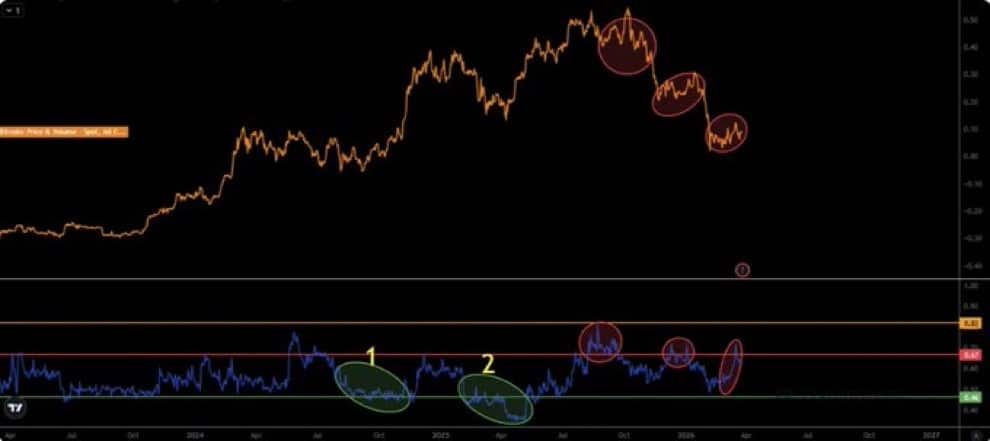
However, the current formation near $72,000 more closely resembles the imbalance zones that preceded sharp declines to $90,000 and later $80,000. In those instances, the imbalance signaled exhaustion rather than continuation.
With this pattern now repeating, the implication is clear: the ongoing rally may not be structurally sound. Instead, it may represent a short-lived advance before a broader downside move, likely driven by long liquidations.
Weak fundamentals limit upside
Beyond technical structure, Bitcoin’s macro and on-chain backdrop does not support a sustained rally.
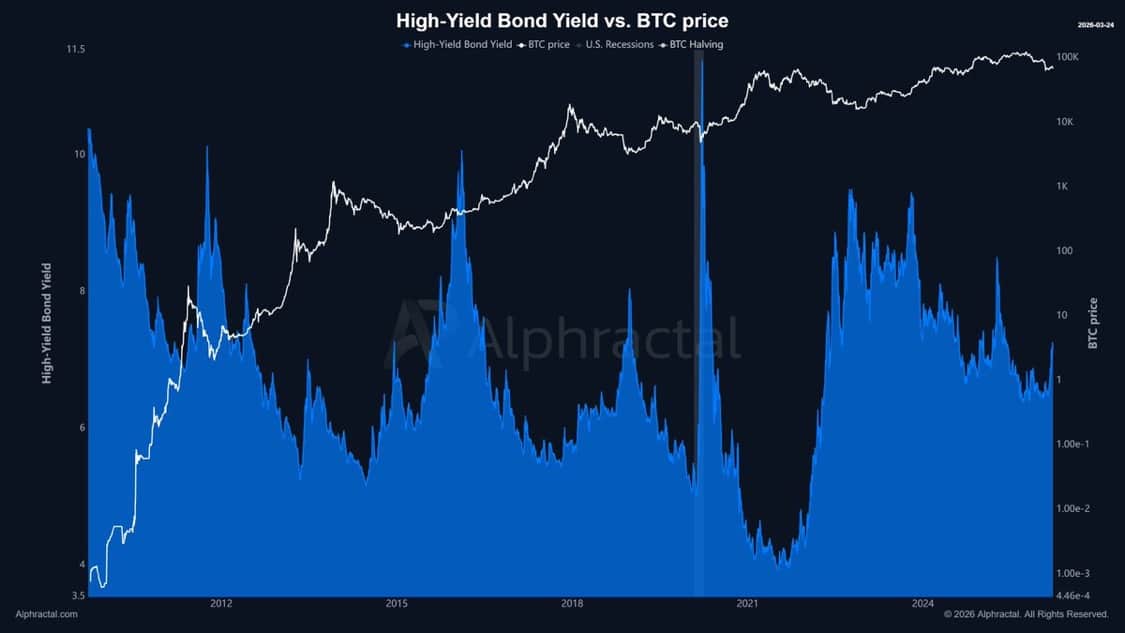
High-yield bond yields continue to rise, reflecting increasing caution among investors. These bonds, issued by lower-rated companies, must offer higher returns to compensate for elevated risk.
When yields climb, it often signals tightening financial conditions and reduced risk appetite.
Historically, such environments have aligned with periods of weakness in Bitcoin, often preceding notable drawdowns. The current rise in yields suggests that broader market conditions remain unfavorable for sustained crypto upside.

At the same time, Spot market activity shows limited participation from retail traders. Trading frequency remains largely neutral, extending a multi-month trend of subdued engagement.
In a strong bullish phase, expanding retail activity typically acts as a key driver of momentum. Its absence indicates that the current move lacks the depth and breadth needed to sustain higher prices.
Accumulation lacks confirmation
While some accumulation is visible in the Spot market, it remains insufficient to confirm a trend reversal.
The Accumulation/Distribution (A/D) indicator shows a modest uptick, suggesting that some investors are beginning to buy. However, this signal remains preliminary.
For a confirmed bullish shift, the indicator must break above its resistance trendline and sustain upward movement. Until then, the current accumulation phase reflects early positioning rather than conviction.


In its present state, Bitcoin’s structure, positioning, and fundamentals point to a fragile rally. Without stronger confirmation, the move toward $72,000 risks being remembered not as a breakout, but as a trap.
Final Summary
- Bitcoin’s supply-demand dynamics continue to follow a recurring fractal pattern that previously preceded sharp declines from the $90,000 and $80,000 regions.
- Structural weakness remains intact, with no confirmed emergence of a momentum-backed rally.
Source: https://ambcrypto.com/bitcoin-nears-72k-but-heres-why-btcs-setup-looks-extremely-fragile/