The price of Bitcoin is currently fluctuating near a critical price range after it went below the $68,000 mark. Currently, Bitcoin’s price is hovering near a short-term support range. This comes as mixed signals are being reflected by overall indicators.
Bitcoin’s current trend is not strong, with sell-offs in the global markets. The loss of the $67,500 support zone may open the door to a new low. However, on-chain analysis offers a broader perspective on the overall trend.
Price Structure Shows Pressure Below Resistance
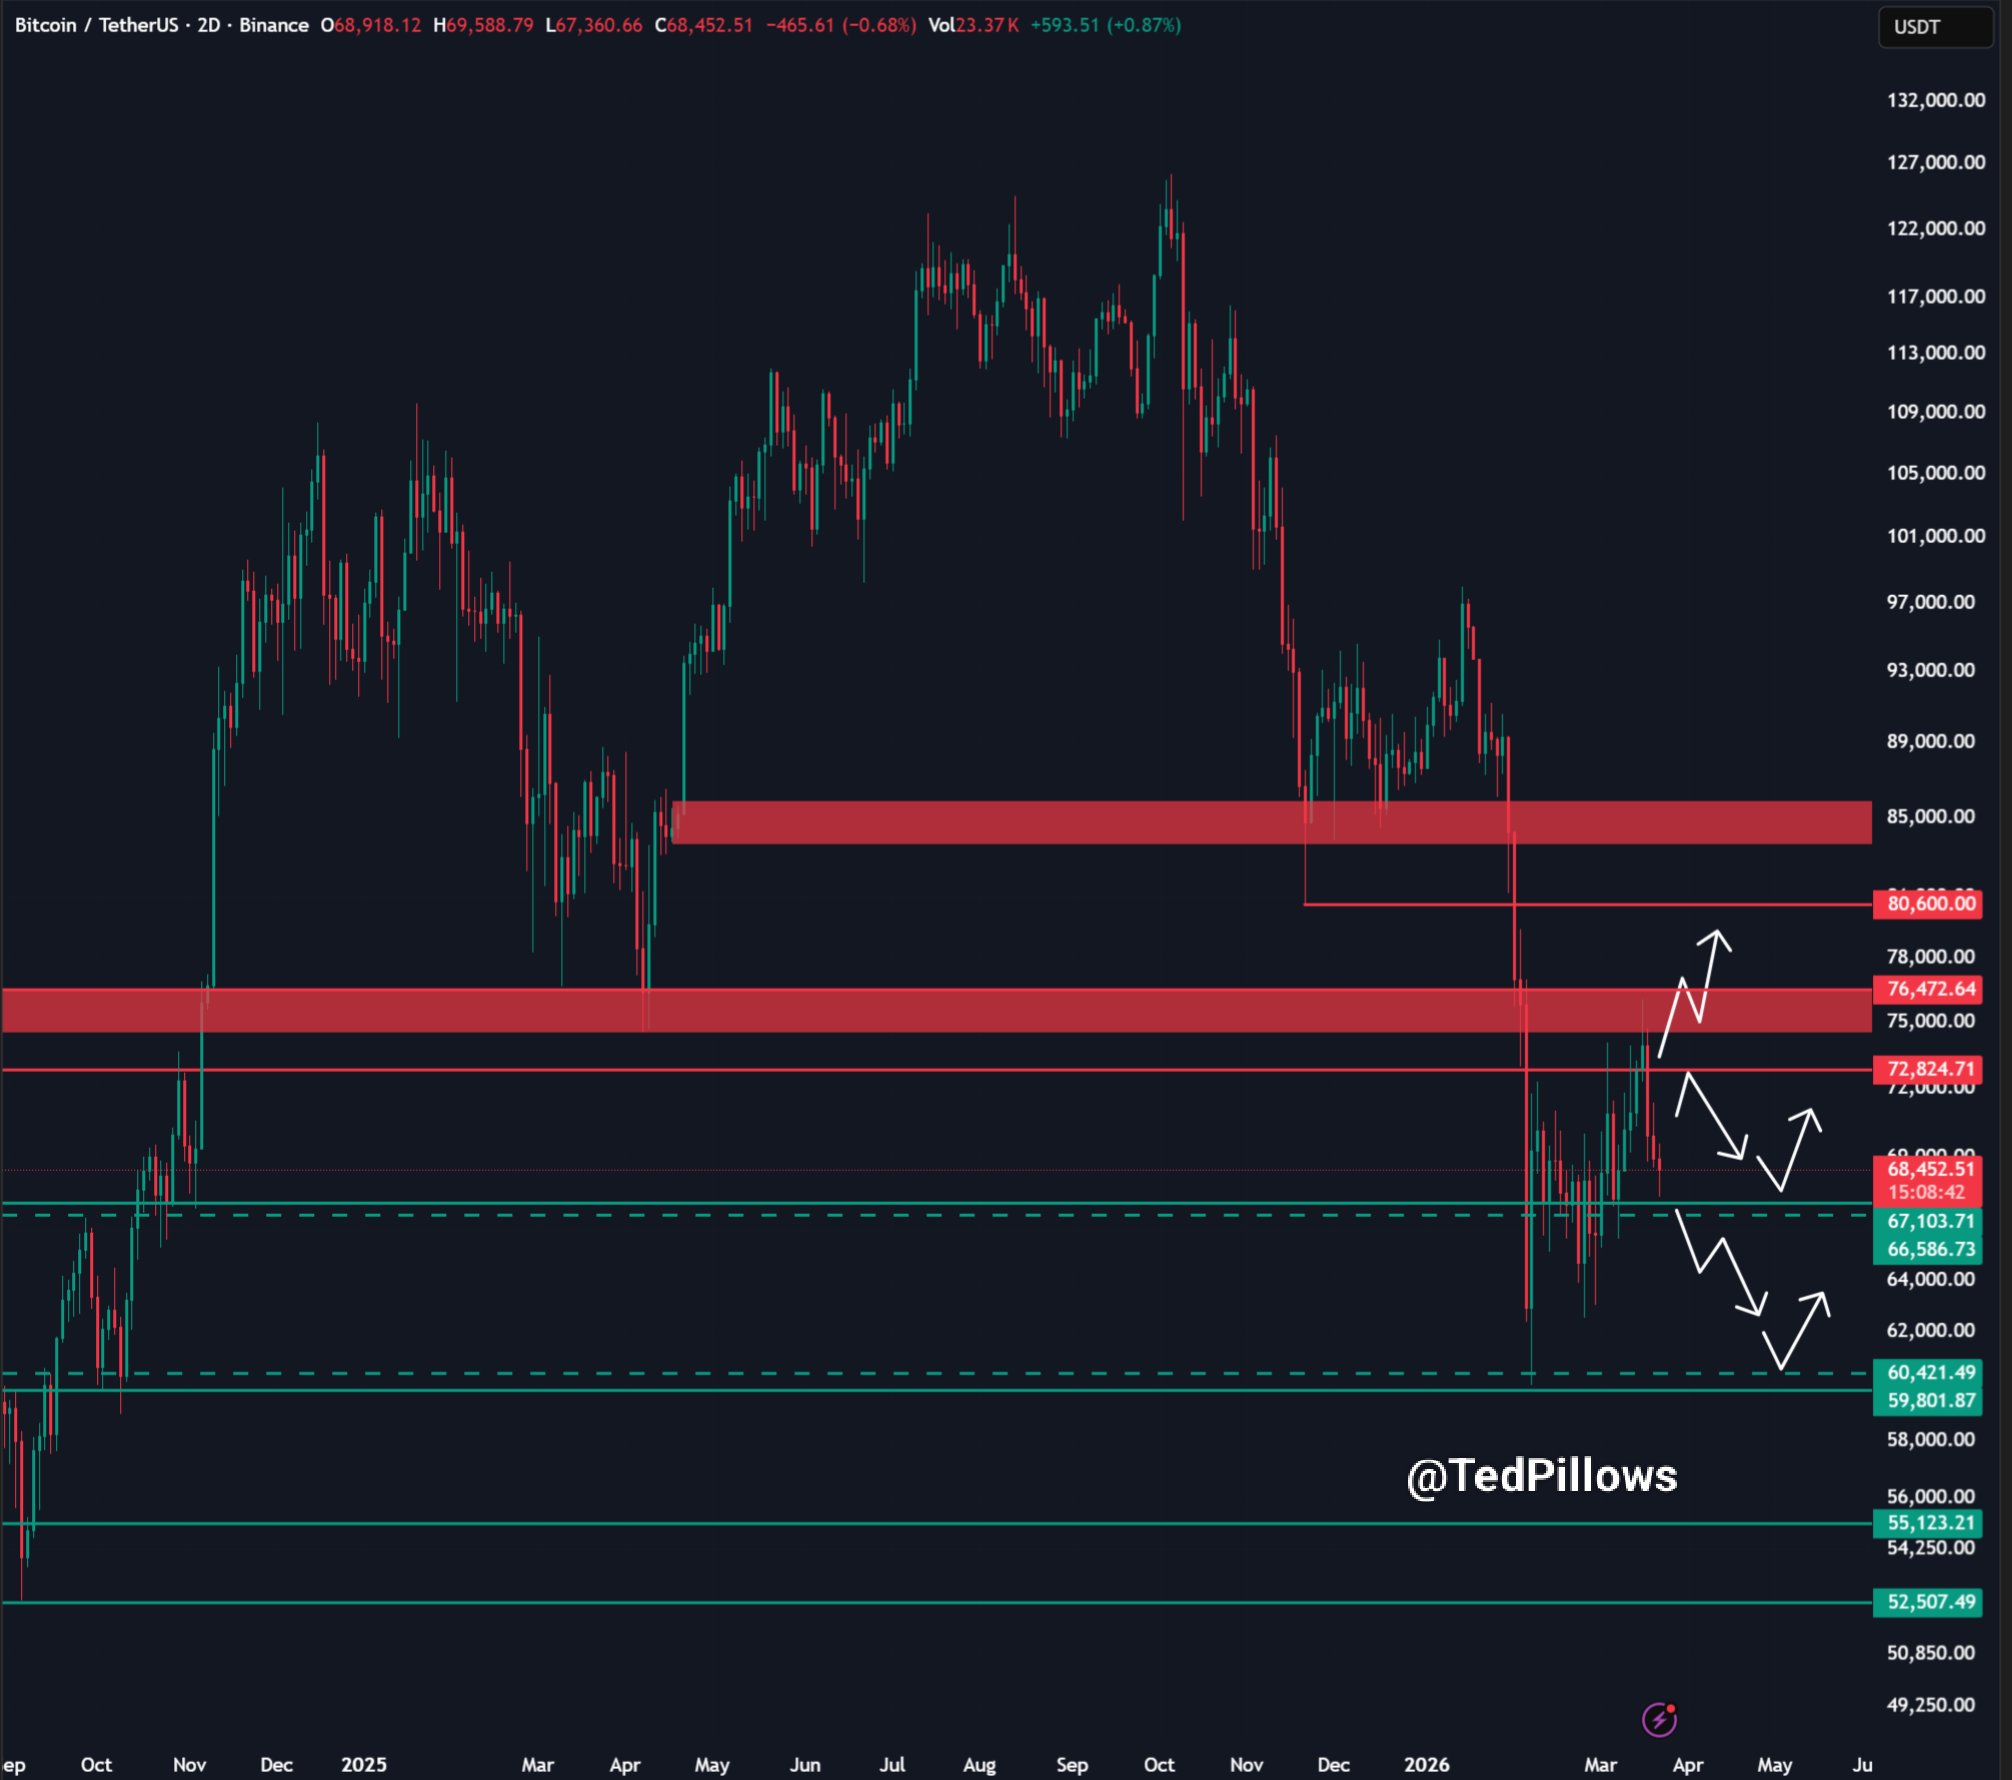
Technical charts indicate that Bitcoin remains below several resistance levels after a previous decline from higher price ranges. Key resistance zones appear around $72,800, $76,400, and $80,600. These levels have limited upward movement in recent sessions.
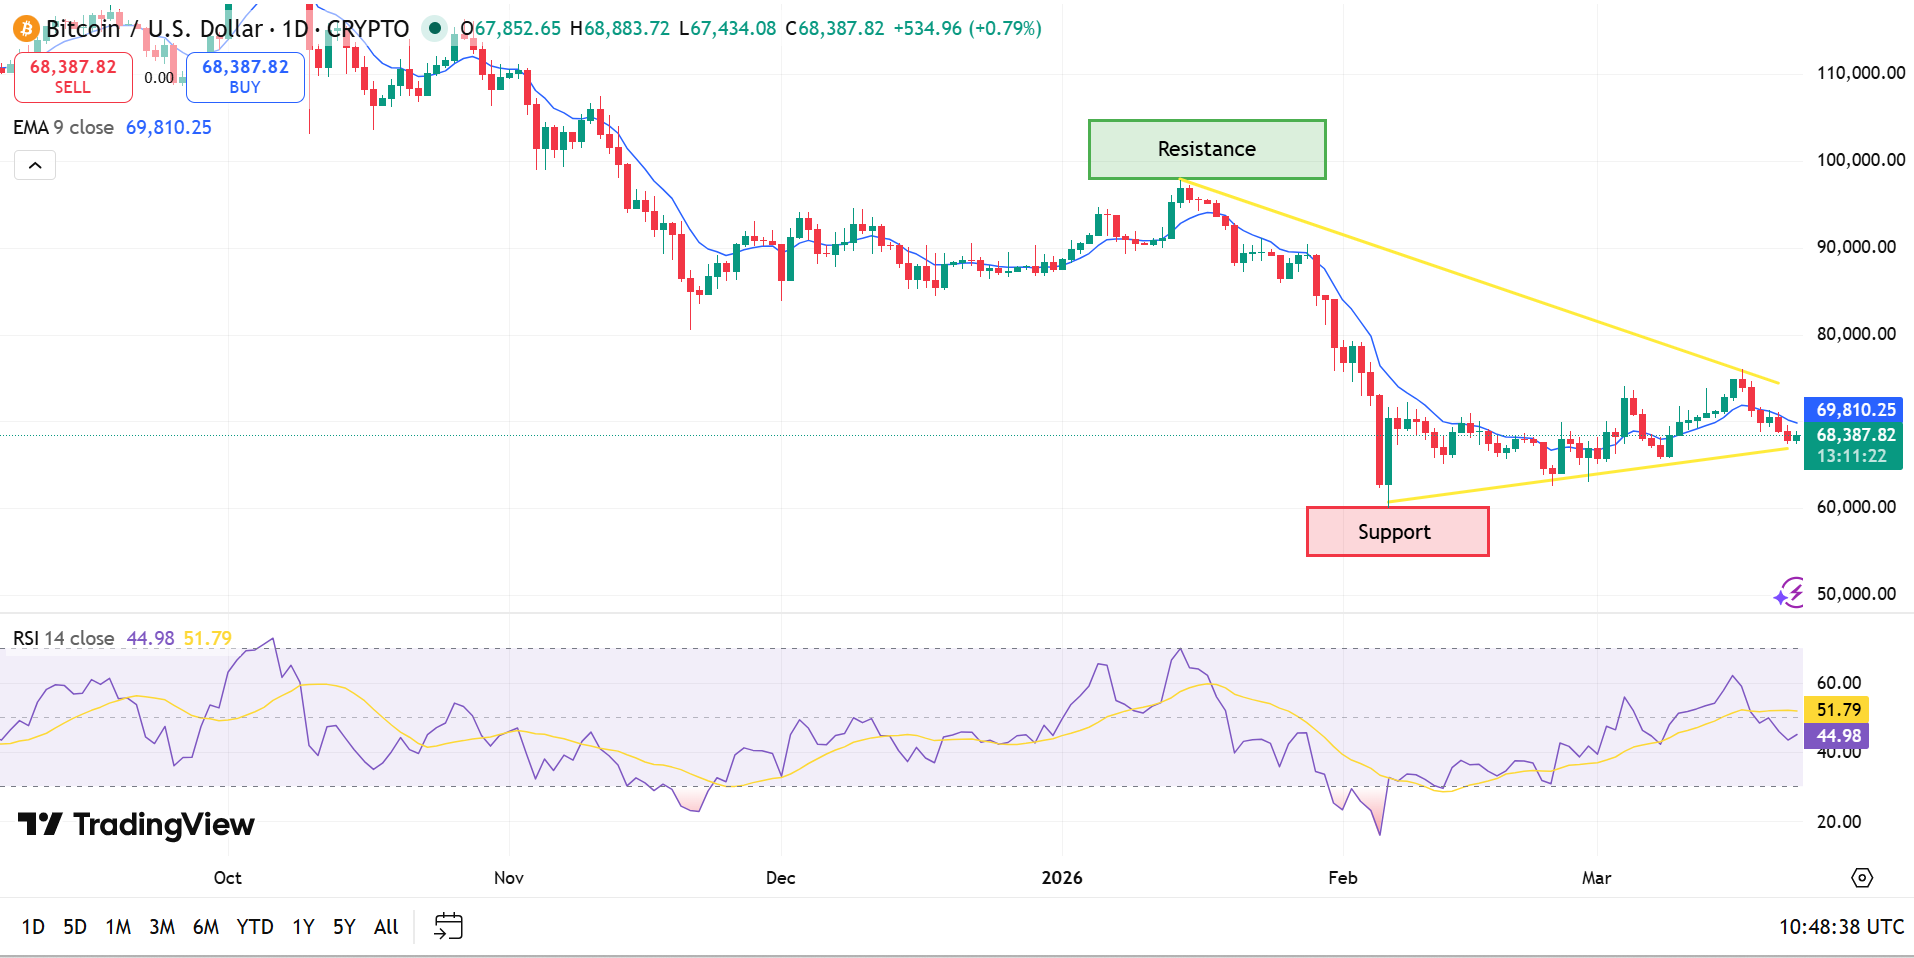
Price action also reflects a consolidation phase in a shrinking range. The price is capped by a falling trendline in the attempt to move upwards. Additionally, the price benefits from a rising support line. This reflects a compression chart pattern.
The price is below a short-term moving average. This reflects low price momentum. Additionally, the Relative Strength Index data reflects low prices in the Relative Strength Index. This is in line with the analyst’s observation on low price momentum.
Support Levels Draw Market Attention
Support remains concentrated around the $67,100 to $66,600 range. This zone aligns closely with the $67,500 level referenced by a user on X. Repeated tests of this area have increased its relevance in the current structure.
If this support fails, the next downside targets appear near $60,400 and $59,800. These levels represent broader demand zones identified on the chart. Lower support areas extend toward $55,100 and $52,500, based on historical price reactions.
The short-term projections from the above chart indicate that there are various possibilities. For instance, there is a possibility that the price may try to recover to the resistance point before declining again. There is also a possibility that the price may break down and move to the lower support zones.
On-Chain Data Reflects Mixed Activity
Glassnode statistics reveal that the market capitalization of Bitcoin has also been declining, similar to its prices.
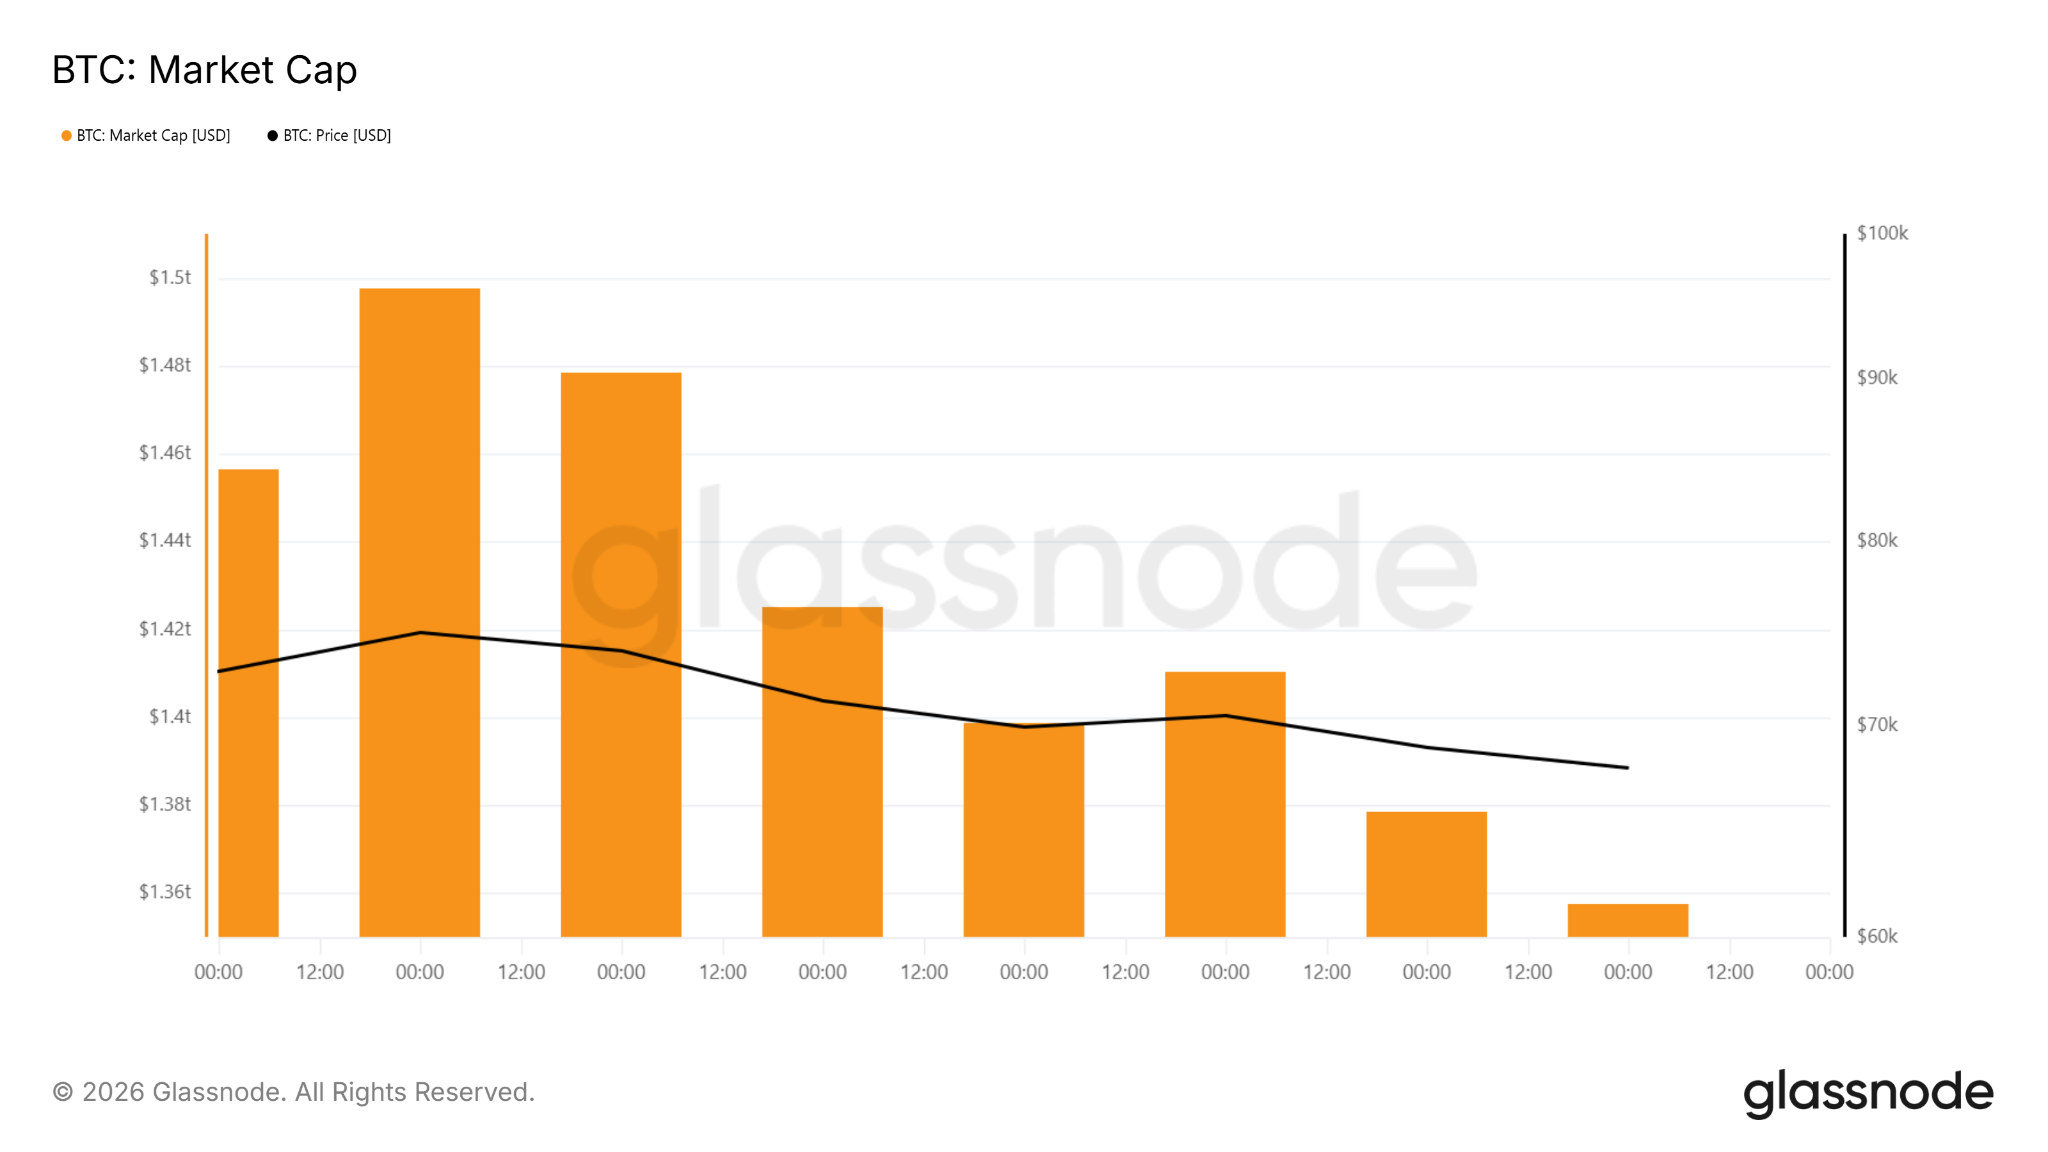
This indicates a decline in the valuation of the network as seen in the selected period. There is a lack of a strong reversal in the trend, as revealed by the provided data.
There has been a decline in active addresses, which previously showed an increase.
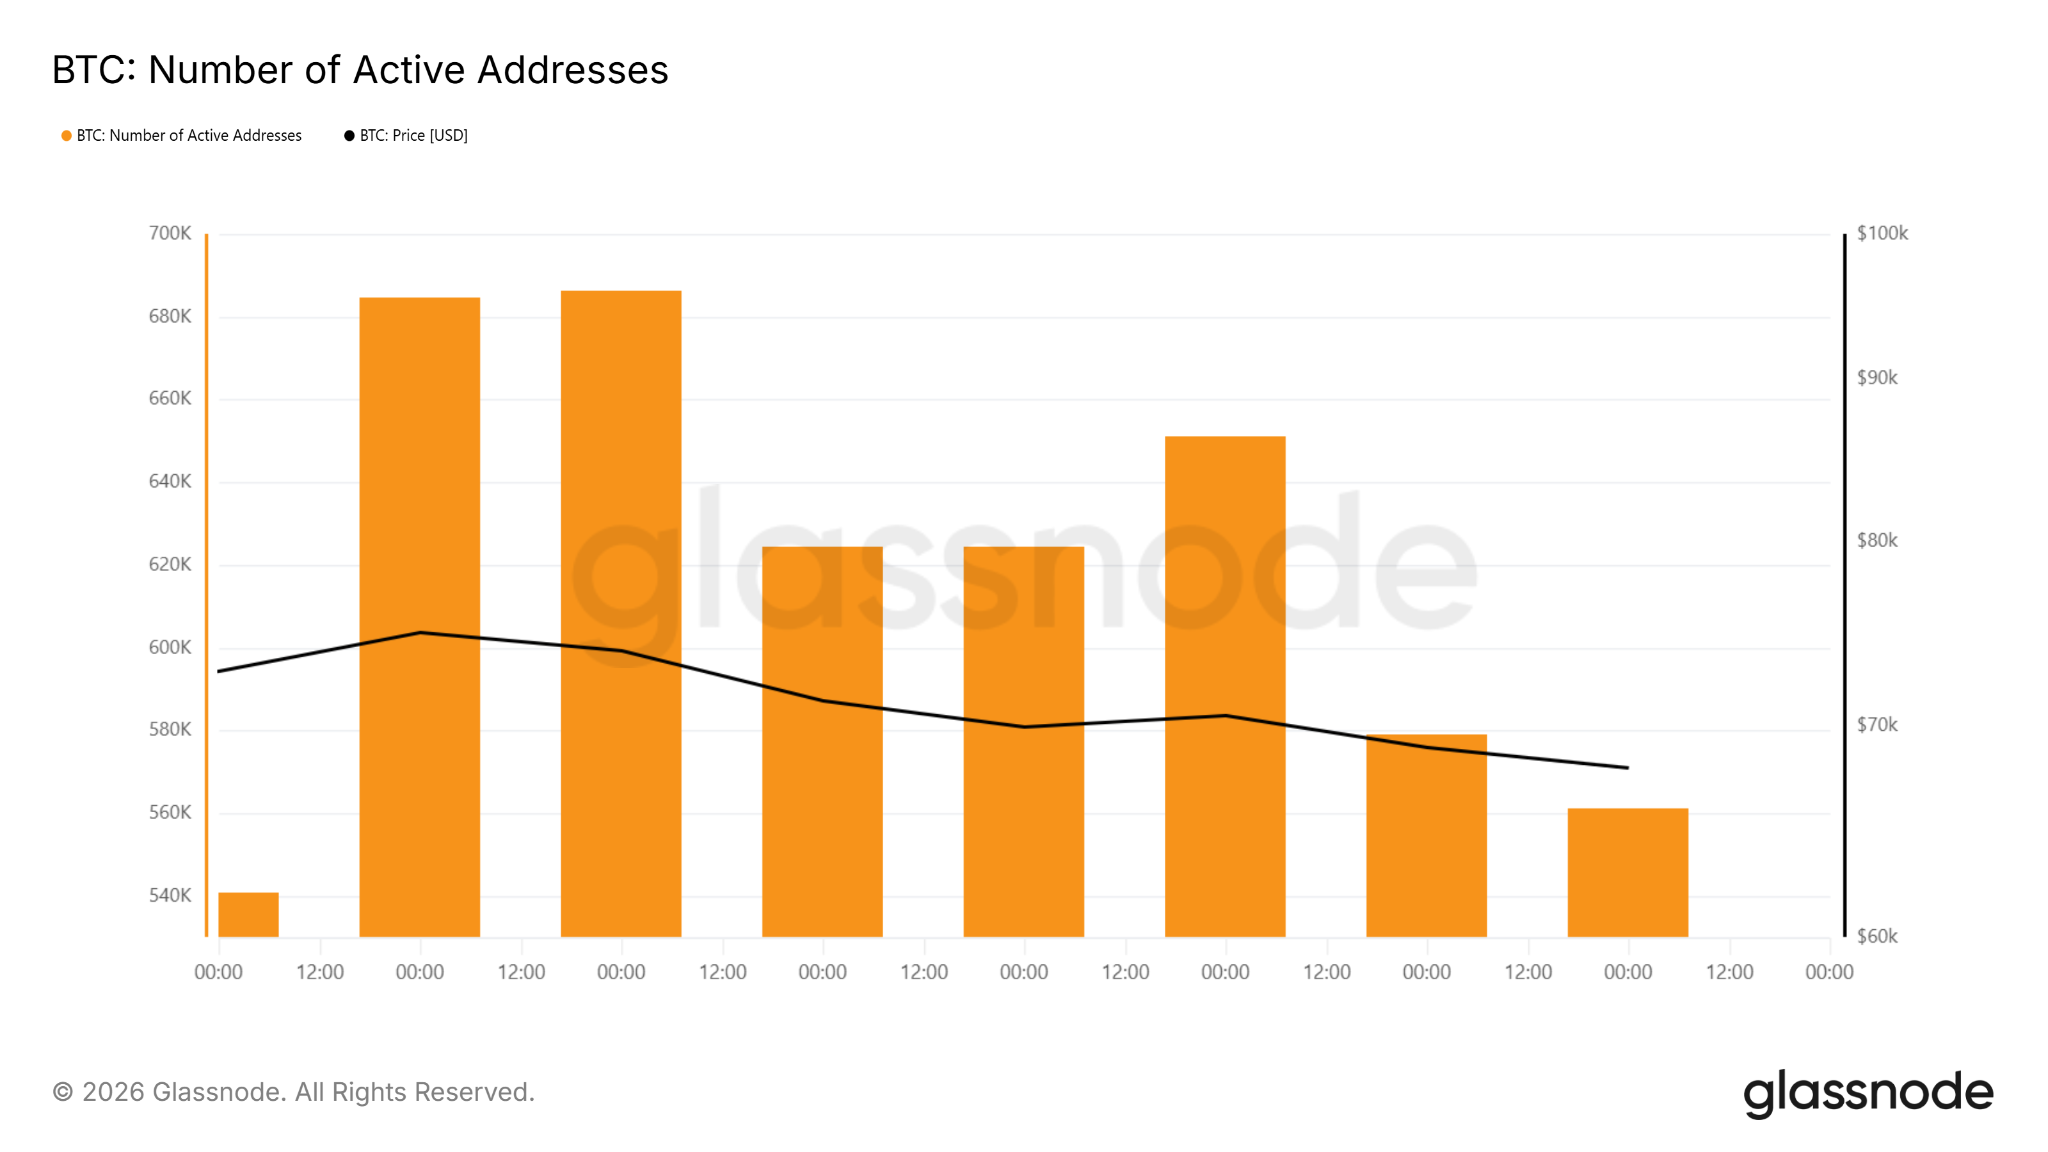
The current decline in active users can be linked to the current price declines.
However, there has been an increase in the number of transactions in recent sessions.
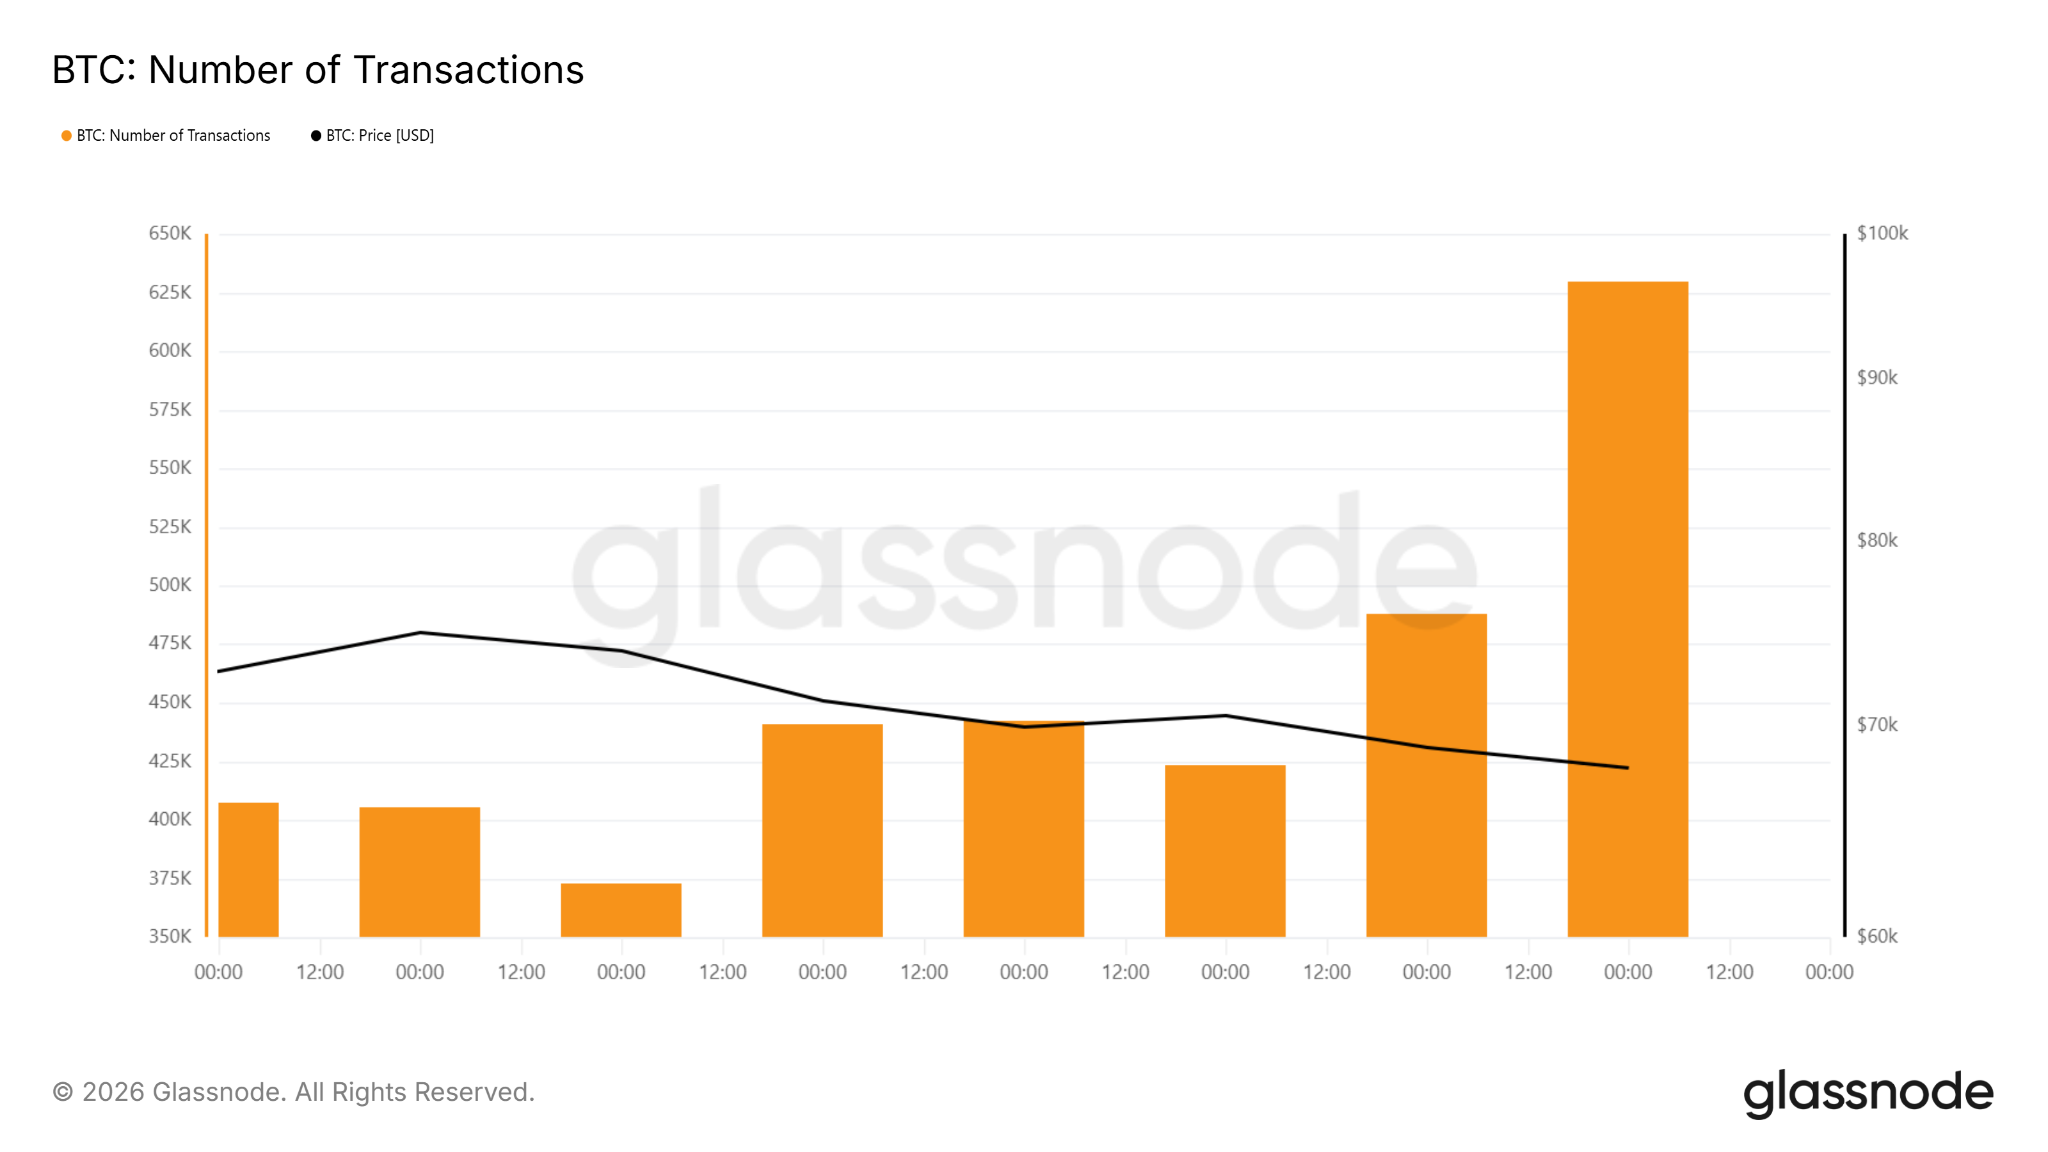
This increase in transactions reveals a rise in the use of the network, despite the declining prices.
Analyst Commentary Aligns With Technical Levels
According to TedPillows, the decline in the value of Bitcoin to below $68,000 is a result of overall pressure in the markets. The author related this to the rise in the rate of sell-offs in global markets.
The chart data confirms the relevance of this level. It is in line with the current support zone, which continues to consolidate. The focus at the moment is confirmation of a breakdown or a recovery.
The Bitcoin price prediction is currently dependent on these levels. If it continues holding on, it might remain in the current range. If it breaks, it might shift focus to lower zones in the near term.
Disclaimer: This analysis is based on market trends and does not guarantee future results. It should not be treated as financial advice. Cryptocurrency investments involve risk, so always do your own research (DYOR) before investing.