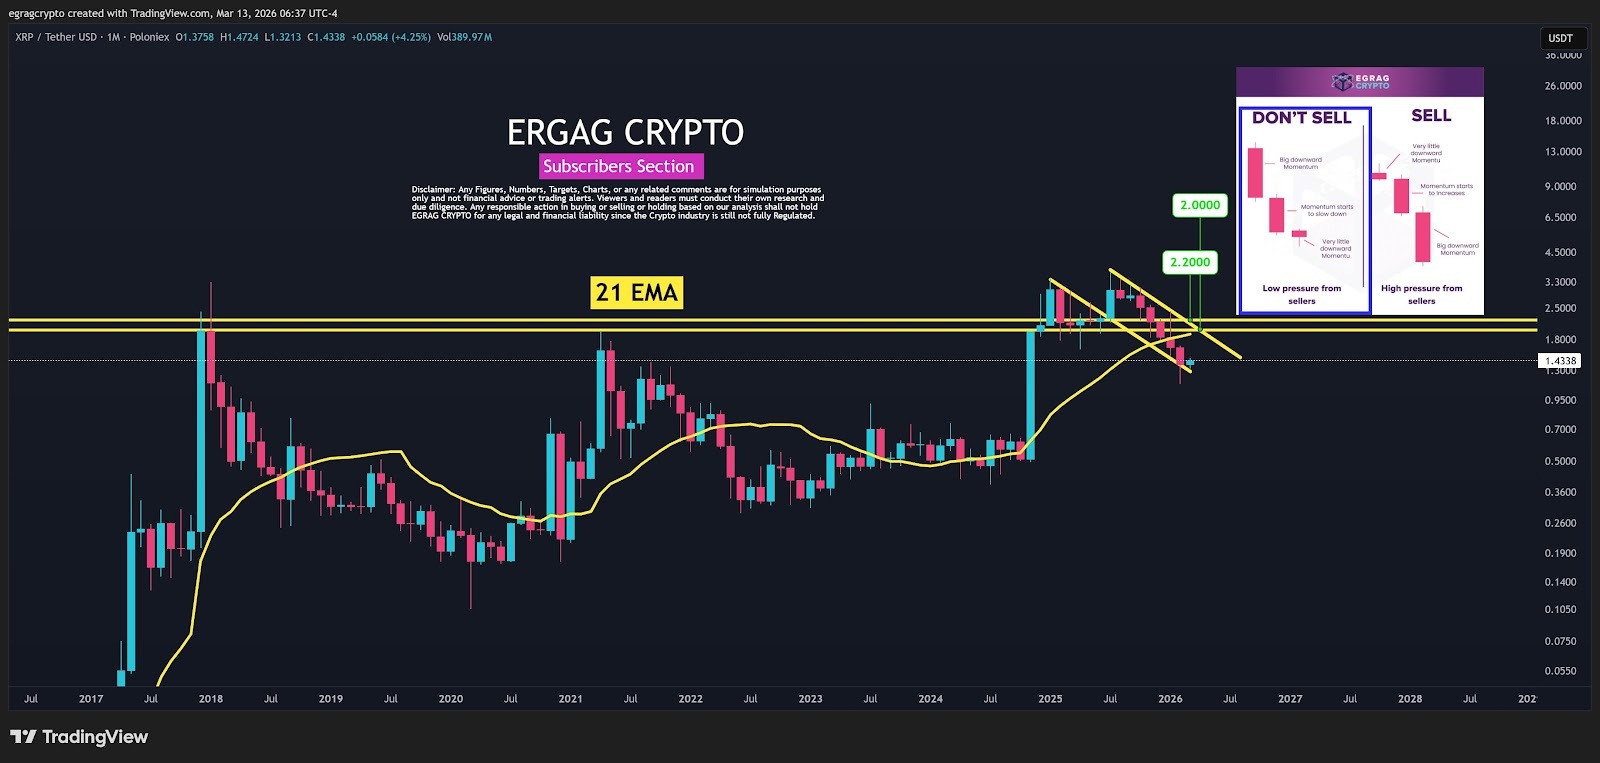
- XRP trades below the 21-day EMA as a descending compression pattern forms.
- XRP faces resistance at $1.80 and $2.20, with a potential 80% rally needed to reach $2.50.
- Possible downside sweep to $0.80–$1.00 may trigger stop-losses and liquidations.
XRP is trading near an important support level as traders await what happens next. The price recently dropped below the 21-day exponential moving average, a tool traders use to measure short-term momentum, after facing resistance around $2.20.
Falling Channel
A chart shared by analyst EGRAG CRYPTO shows XRP forming a falling channel (also called a descending compression pattern). This means the price is moving downward within a narrowing range and creating lower highs.
Traders often see these compression patterns as periods where volatility slows before a bigger move. For now, XRP’s price action looks more like a controlled pullback than a sharp drop.
The chart also shows smaller candles and weakening downward momentum. These signs may suggest selling pressure is easing, but they don’t yet confirm that the price will reverse upward.
Key XRP Price Levels to Watch
Traders are closely watching a few price levels that could determine XRP’s next move. According to EGRAG, one key scenario is a price move back above the $1.65–$1.80 range. If XRP reclaims this area, short-term momentum could improve, and the token may try to retest higher resistance levels.
XRP is currently trading around $1.39, down 2.5% in the past 24 hours. While the token has gained 6.9% over the past two weeks, that increase has not yet recovered from its 39% drop over the past year.
If XRP moves above $1.80, the next level traders are watching is $2.20. A breakout above that could open the door for a move toward $2.50. From the current price, reaching $2.50 would require roughly an 80% rally.
If momentum continues beyond that, some traders think XRP could eventually aim for its previous all-time high of $3.84 set in 2018.
Meanwhile, another possible scenario is a liquidity sweep to the downside. This happens when the price briefly drops to trigger stop-loss orders before reversing upward. In this case, some traders are watching the $0.80–$1.00 range as a potential liquidity zone.
Moves like this can also lead to more liquidations in leveraged futures positions, as sudden price swings force traders using borrowed funds out of their trades.
Other Analysts Weigh in on XRP
Elsewhere, a chart shared by Ali Martinez shows a multi-year triangle on XRP’s monthly chart, with support at $0.90 and $1.38, and resistance at $1.60 and near $3.32, the 2017–2018 peak.
XRP has formed higher lows since a cycle bottom near $0.11. Notably, projections suggest levels of $27.17 and $48.12 by 2030 are possible if the trend continues. However, many consider these prices overambitious given the current market.
Related: XRP Faces Make-or-Break Moment as Triangle Pattern Tightens
Disclaimer: The information presented in this article is for informational and educational purposes only. The article does not constitute financial advice or advice of any kind. Coin Edition is not responsible for any losses incurred as a result of the utilization of content, products, or services mentioned. Readers are advised to exercise caution before taking any action related to the company.
Source: https://coinedition.com/xrp-could-turn-bullish-again-if-price-reclaims-1-65-1-80-range/