Bitcoin price bounced back sharply on Friday, moving from the intraday low of $60,300 to $69,300 as crypto investors bought the dip. Still, BTC price will likely have some more volatility as the funding rate tumbles to the lowest level since 2023 and as a big options expiry nears.
Bitcoin Price on Edge as the Funding Rate Falls Ahead of Options Expiry
Bitcoin, the original cryptocurrency, has come under pressure this year. It plunged to a low of $60,245, down sharply from the highest point in October last year.
Data compiled by CoinGlass shows that the coin’s funding rate in the futures market plunged to the lowest level since 2023. Funding rate is an important metric in the futures market that looks at the micro payments that longs and shorts pay each other.
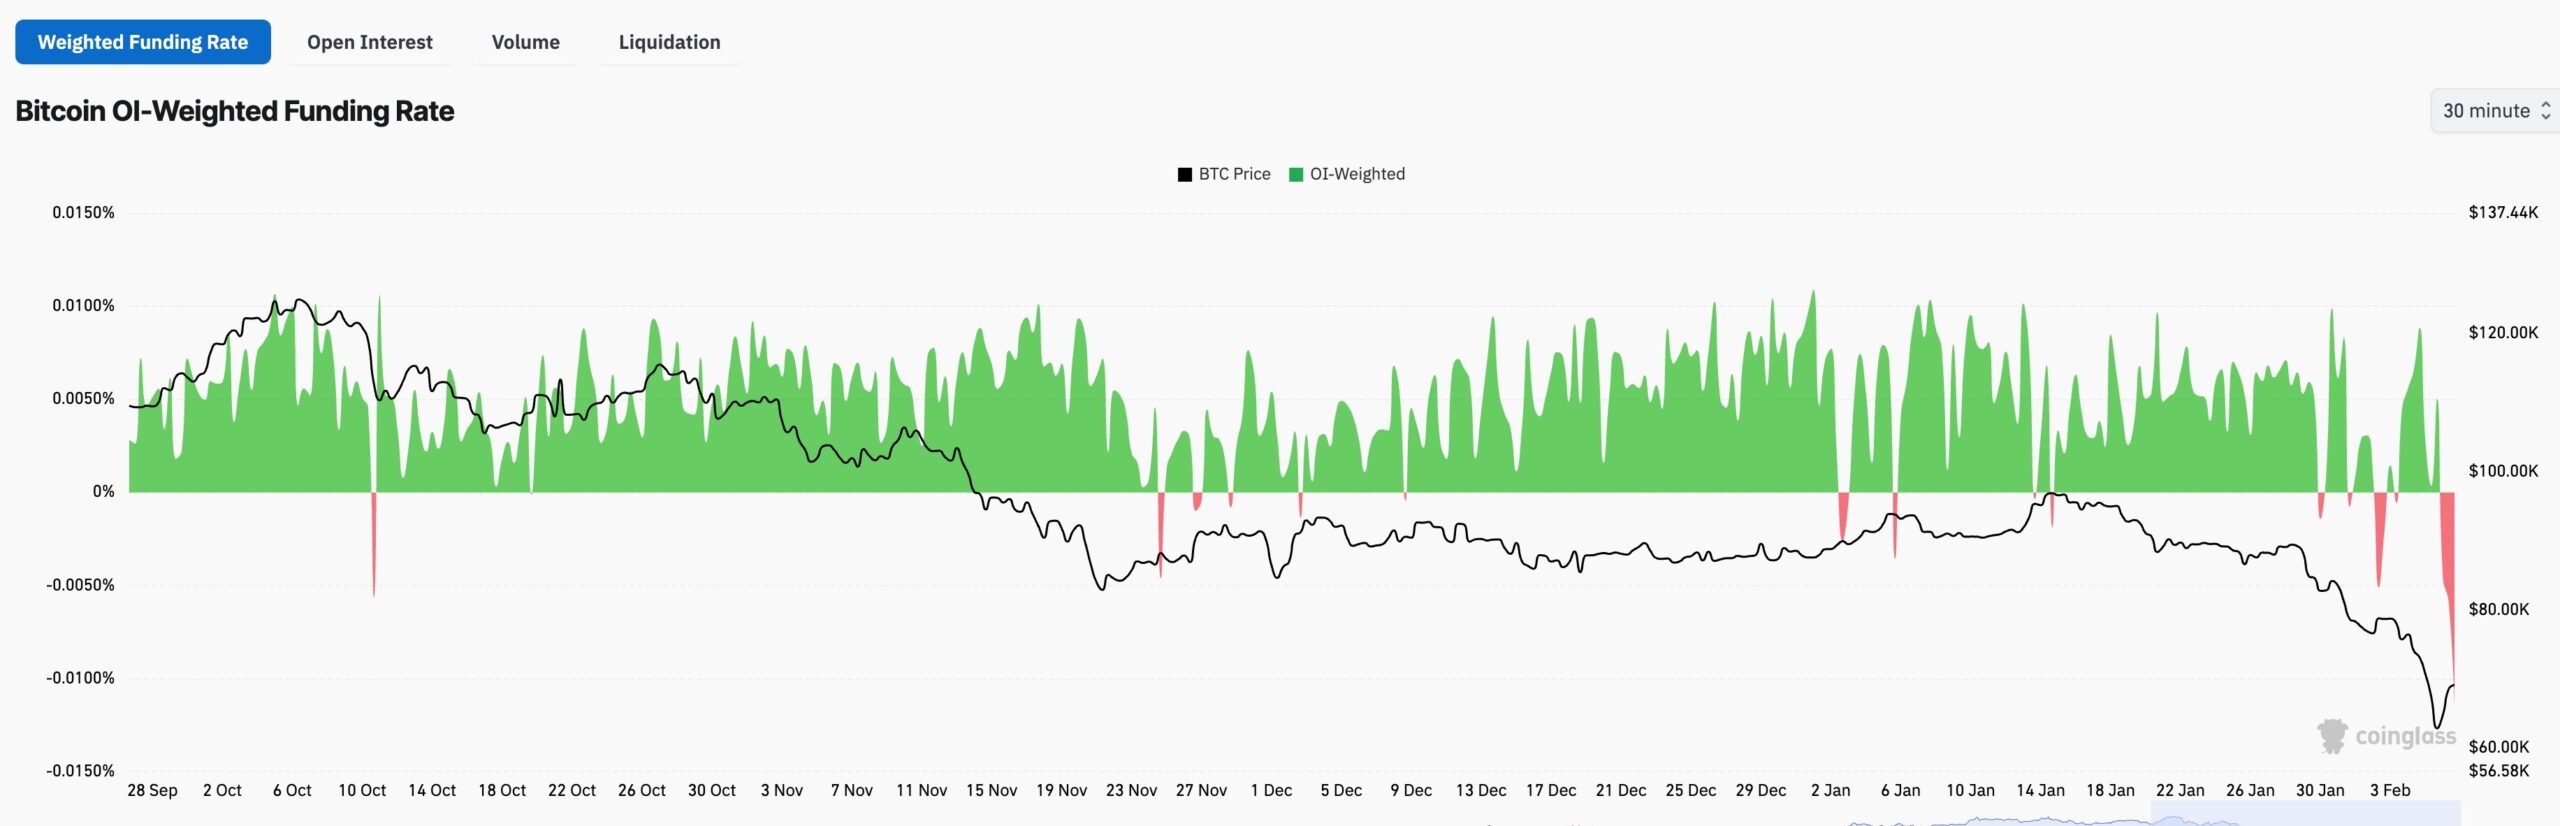

A negative funding rate means that shorts are paying bulls, a sign that they expect the price to remain in the red for a while. This rate dropped as positions worth over $1 billion were liquidated in the last 24 hours. Most notably, the futures open interest dropped sharply as investors continued to reduce their leverage.
This increased volatility occurred as Bitcoin options worth over $2.1 billion are set to expire late today. Data shows that the put/call ratio is 0.60, a sign of earlier bullish positioning before prices fell. The maximum pain point was $82,000, meaning that many calls are deeply out-of-the money.
Bitcoin’s recovery happened as the Crypto Fear and Greed Index plunged to the lowest level in years. Most crypto bull runs start when the index crashes to the extreme fear zone.
Additionally, it coincided with the recovery of risky assets. The Nasdaq 100 Index rebounded by over 400 points, while the MSTR stock soared by over 17% after a bullish call by Cowen.
BTC Price Prediction: Technical Analysis
The weekly chart shows that the ongoing Bitcoin price could be about to end. For one, the Relative Strength Index has moved to the oversold level for the first time since July 2022. BTC price has always bounced back whenever it moved to the oversold level on the weekly chart.
Bitcoin price also hit the target of the rising wedge pattern. The chart shows that the widest point of this wedge was about 42%. Measuring the same distance from the breakout point gives a target of $60,000.
Additionally, there are signs that the value of BTC is forming a hammer candlestick pattern. A weekly close above $69,000 will confirm the hammer and point to more gains.
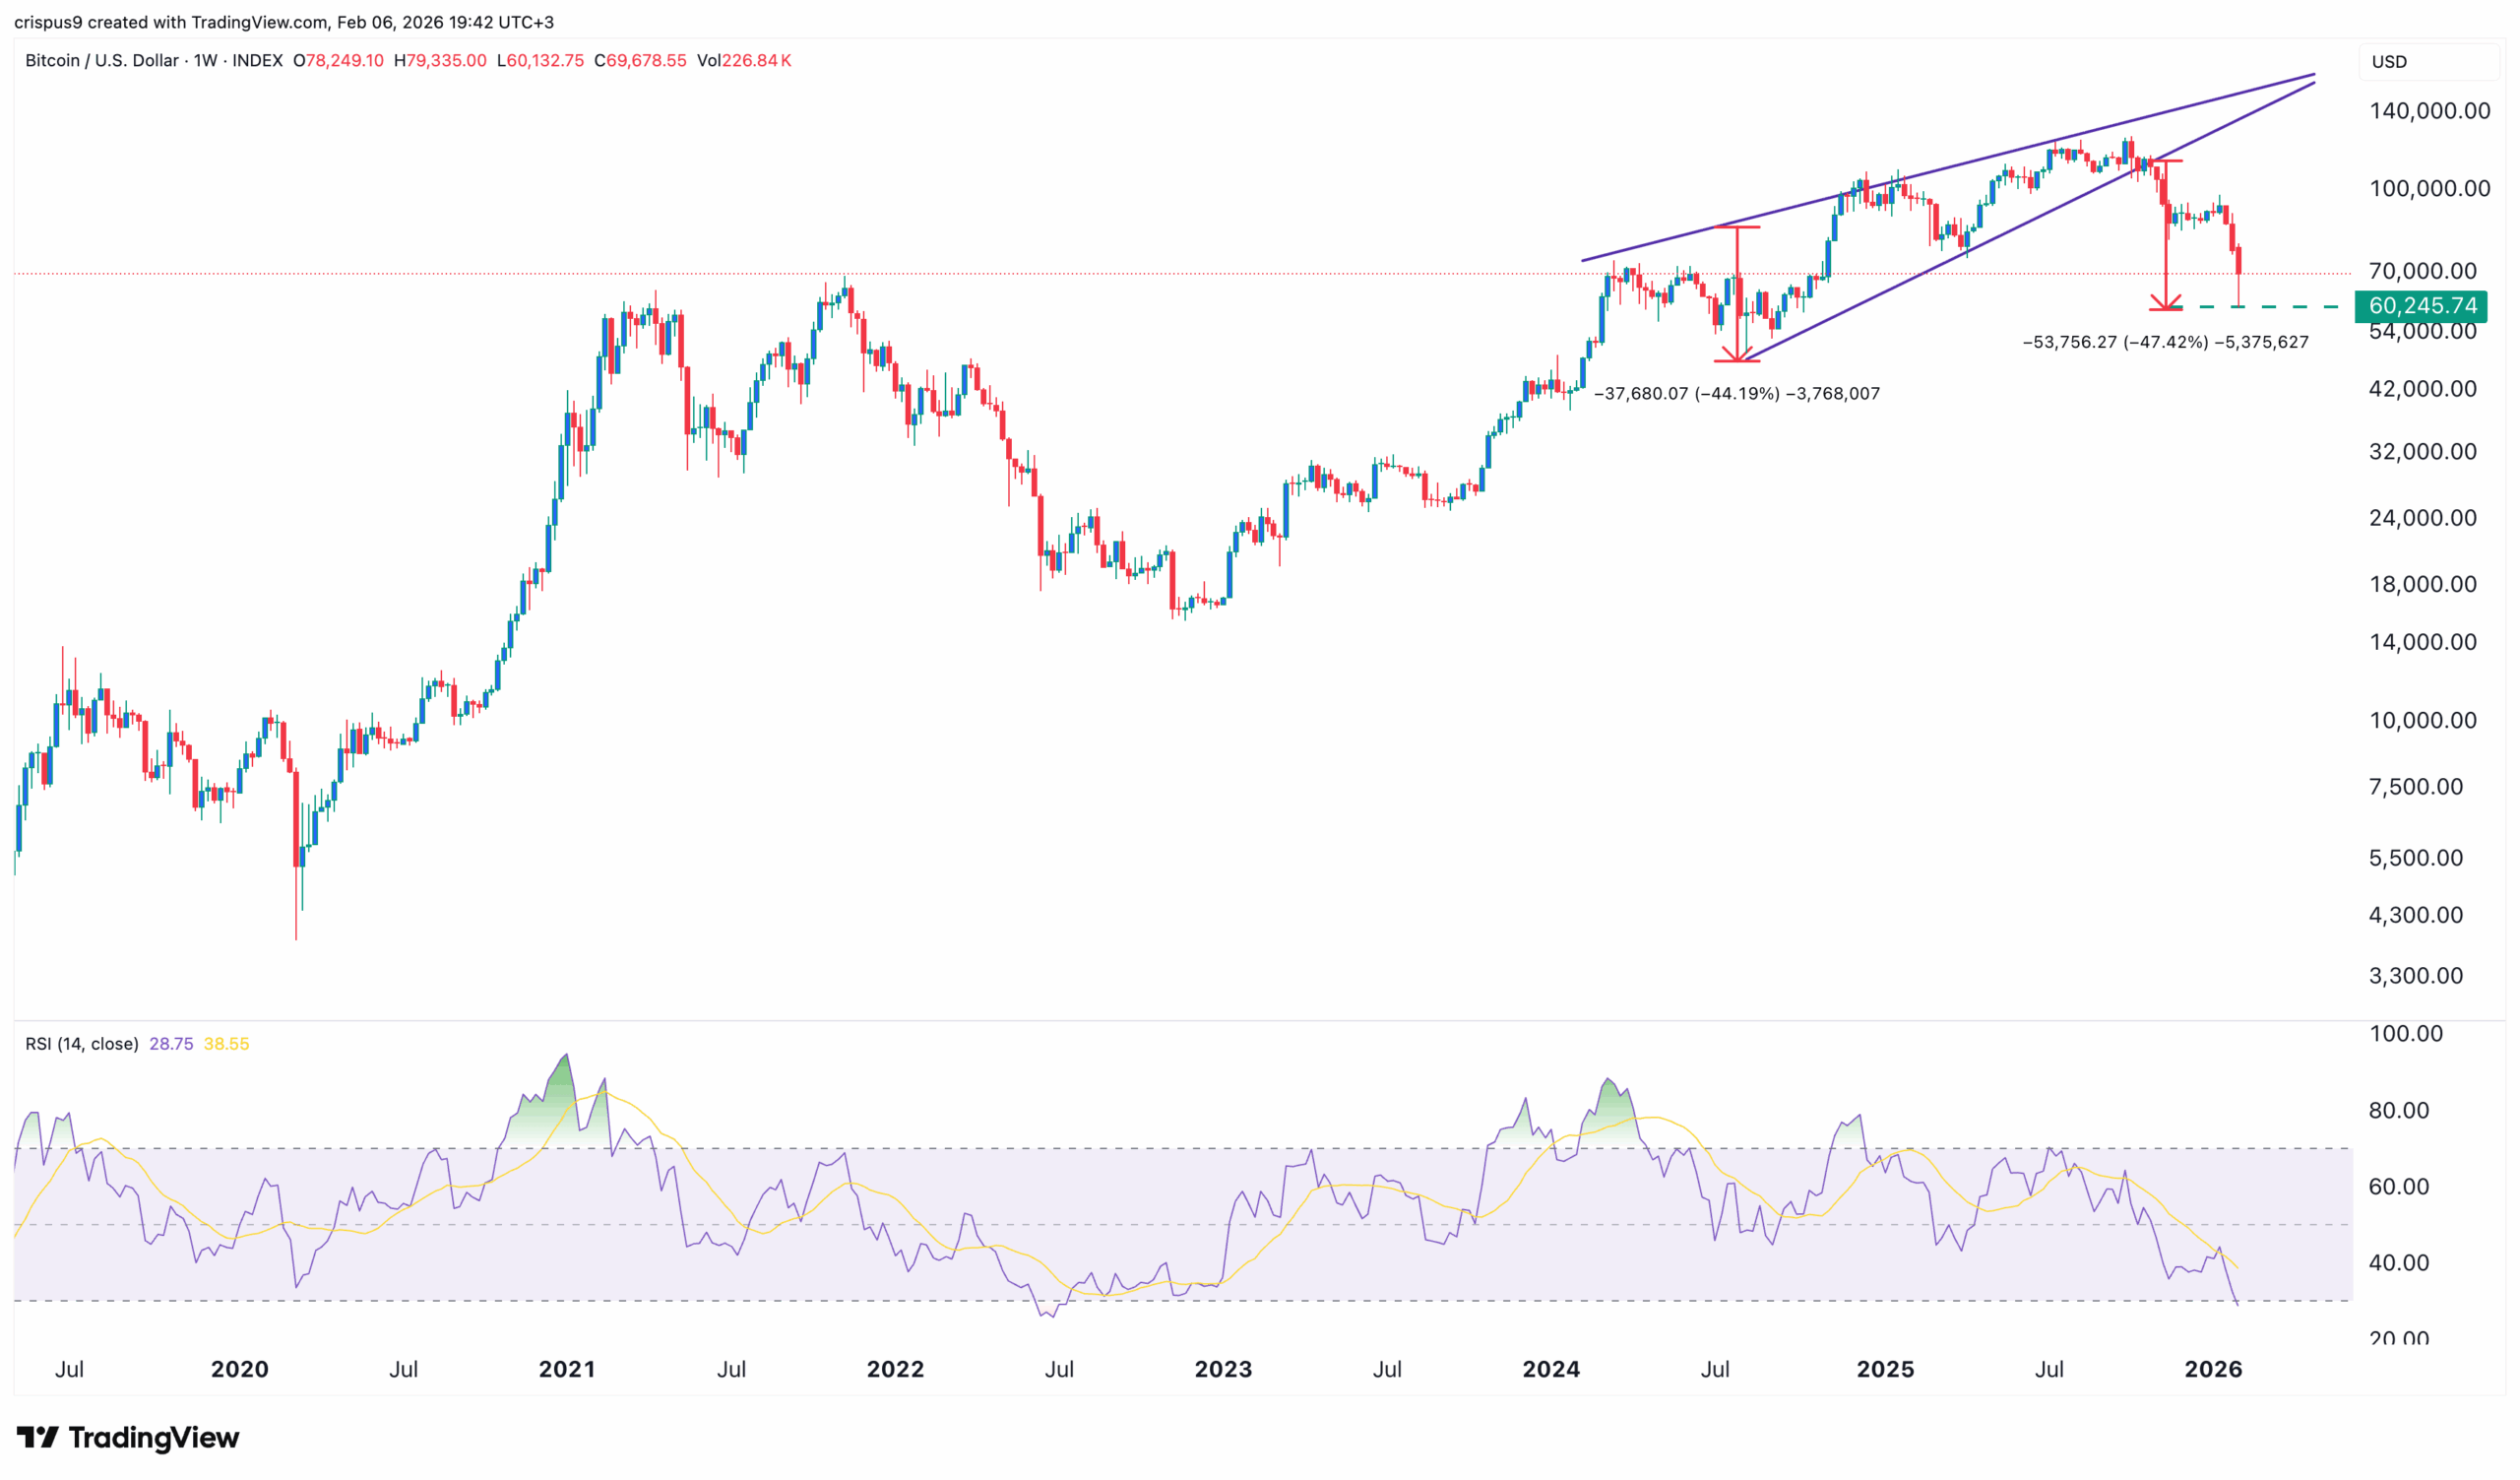

However, the main risk to remember is that this price action could be a dead-cat bounce. A DCB is a situation where a crashing asset rebounds briefly and then resumes the plunge.