Memecore [M] continued its remarkable recovery streak, extending the uptrend despite unfavorable market conditions.
Memecore successfully defended the $ 1.20 support level, rising from $1.19 to a local high of $1.52, nearly erasing all recent losses.
At the time of writing, Memecore [M] traded at $1.5, up 12.06% on the daily charts. Over the same period, its market capitalization reached an intraday high of $2.2 billion, reflecting substantial capital inflows.
Memecore sees seller exhaustion
Amid a broader market sell-off, Memecore faced significant downward pressure, breaching the $1.2 support level.
After it crossed this market, the market experienced seller exhaustion, and buyers stepped in to accumulate at a discount. In fact, the Buy & Sell volume-to-price pressure indicator indicates a return of buying pressure in the market.


Source: TradingView
As such, buy pressure made a bullish crossover from heavy selling and reached a high of 25, at press time. At the same time, seller pressure fell to 21, resulting in net buying.
Coupled with that, Buyer strength rose to 63 while seller strength dropped to 36, indicating increased seller dominance in the market.
When buyers dominate the market, they reduce supply and absorb the arising selling pressure, positioning an asset for an upward movement.
Traders aggressively bet against the market
In addition to a buyer returning to the market, Memecore experienced significant upside pressure from the futures market, as traders engaged in speculative shorting.
According to CoinGlass, Derivatives Volume rose 37% to $70.7 million, while Open interest (OI) climbed 26% to $31.3 million as of writing. Often, when OI and volume rise in tandem, it signals increased participation and capital flow into the futures market.
Meanwhile, the memecoin’s Long Short Ratio remained below 1, falling further to 0.9. Amid this dip, Binance Top Traders’ accounts recorded the lowest ratio of 0.4.


Source: CoinGass
With this metric dropping to such low levels across exchanges, it suggests that most traders either on Binance or OKX have been largely bearish. Thus, most participants were actively taking short positions, reflecting increased bearishness.
Thus, although prices rebounded, Memecore investors perceived this shift as short-lived and expected prices to drop again.
Sustainable or a short-term bubble for M?
Memecore saw increased capital rotation as investors rushed to defend the market from further declines. At the same time, traders in the futures market aggressively placed short positions, further strengthening demand.
As a result, the memecoin’s Stochastic RSI increased from 4 to 49 at press time, indicating strong upward momentum driven by increased selling pressure.

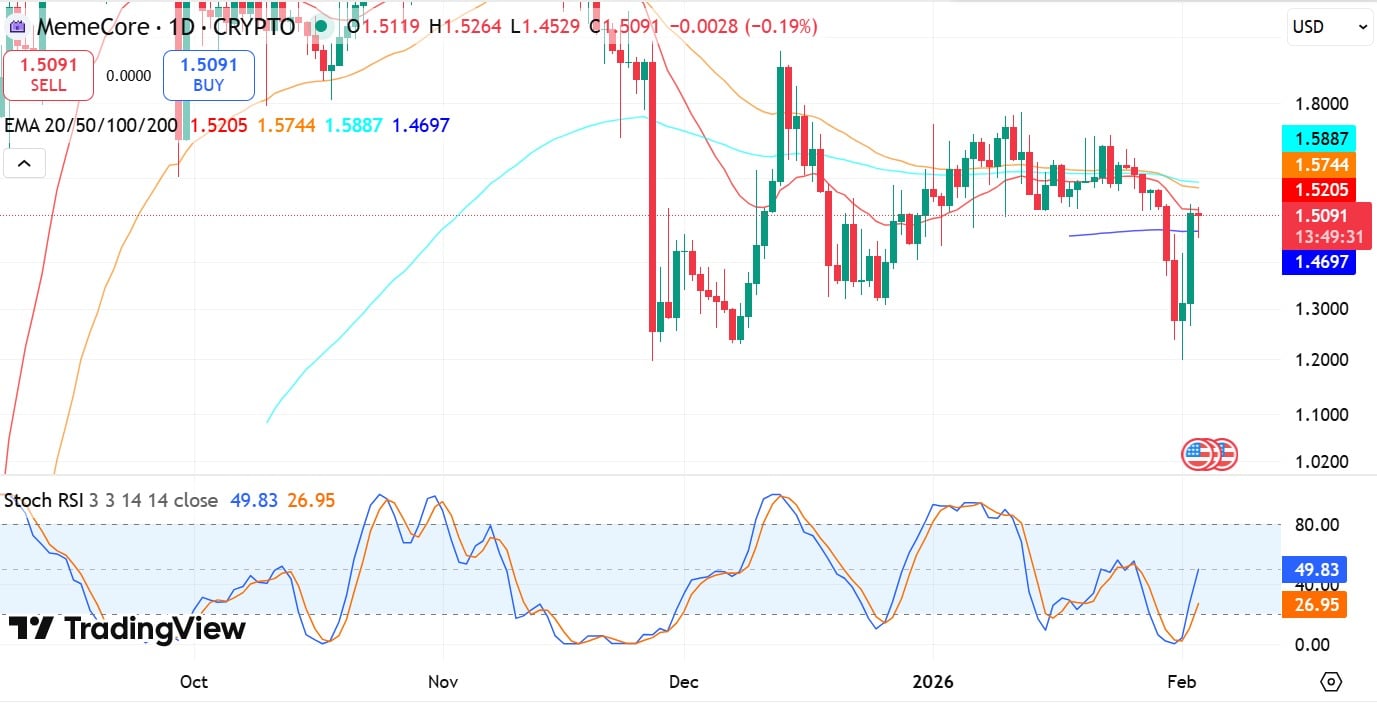
Source: Tradingview
Likewise, M successfully flipped its EMA20 at $1.46 and was testing EMA 50 at $1.52, further validating the trend’s strength.
These prevailing conditions leave M in a favorable position for further gains. Thus, if demand holds, M could flip $1.52 and target its key resistance at $2.58.
However, if the speculative bubble in the futures market bursts, Memecore will decline to $1.3, with $1.2 as the critical support level.
Final Thoughts
- Memecore successfully held $1.2 support and jumped to a local high of $1.52.
- M rebounded as buyers stepped in and bought the dip, while futures scrambled with speculative shorting.
Source: https://ambcrypto.com/memecore-why-ms-2-58-target-depends-on-breaking-this-level/