Amid a broader market slump, Bitcoin fell to April 2025 levels, reaching a low of $ 75,519 before slightly recovering. As of this writing, BTC traded at $78,862, down 4.61% on the daily charts and 10% on weekly charts.
Amid this prolonged downtrend, BTC has experienced reduced investor appetite, with traders taking a step back and others reducing exposure.
Bitcoin capital inflow dries up
According to Ki Young Ju, Realized Cap has flatlined, indicating no fresh capital has flowed into Bitcoin recently.
In fact, capital flows into Bitcoin have almost entirely dried up almost entirely. The analyst noted that when market capitalization declines in that environment, it signals that the market is in a deep bearish zone.
Bitcoin [BTC] experienced substantial capital inflows due to continued accumulation by Strategy (formerly MicroStrategy) and Spot ETFs.
In fact, MSTR added 523k BTC between 2024 and 2026, a jump from 189k to 712k, thereby increasing demand for Bitcoin.


Source: CoinGlass
During this period, MSTR pumped more than $50 billion into Bitcoin without any outflows, thereby strengthening its demand side.
At the same time, the approval of ETFs led to substantial capital inflows into Bitcoin, with total assets exceeding $100 billion.
These strong capital inflows from institutional investors kept BTC prices elevated, and now these inflows have dried up.
Selling pressure dominates the market
While capital inflows have dried up, selling pressure has persisted from both retail and institutional investors.
For starters, outflows have dominated the ETFs market, with outflows hitting $1.3 billion between the 29th and 30th of January. The trend has remained significant, with net inflows occurring only once in the past ten days.

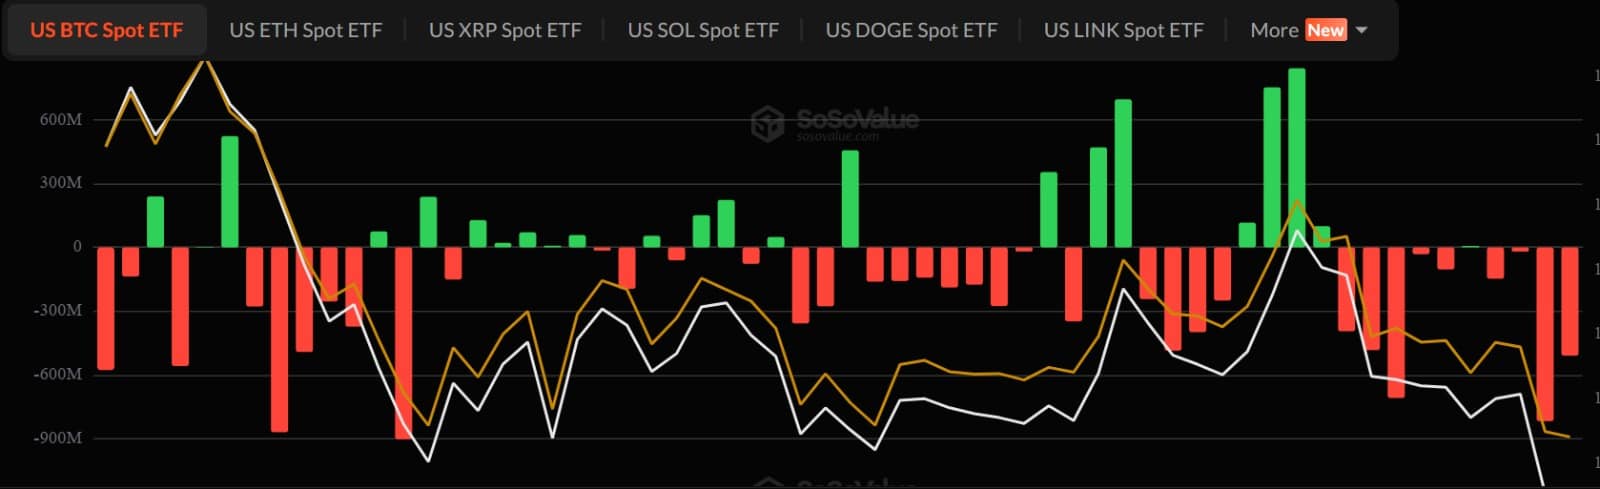
Source: SoSoValue
Such a sustained period of outflows suggests that institutional investors have widened and reduced their exposure.
Moreover, exchange activities have signaled this distribution phase. According to CryptoQuant data, Bitcoin recorded higher inflows for the past three consecutive days.

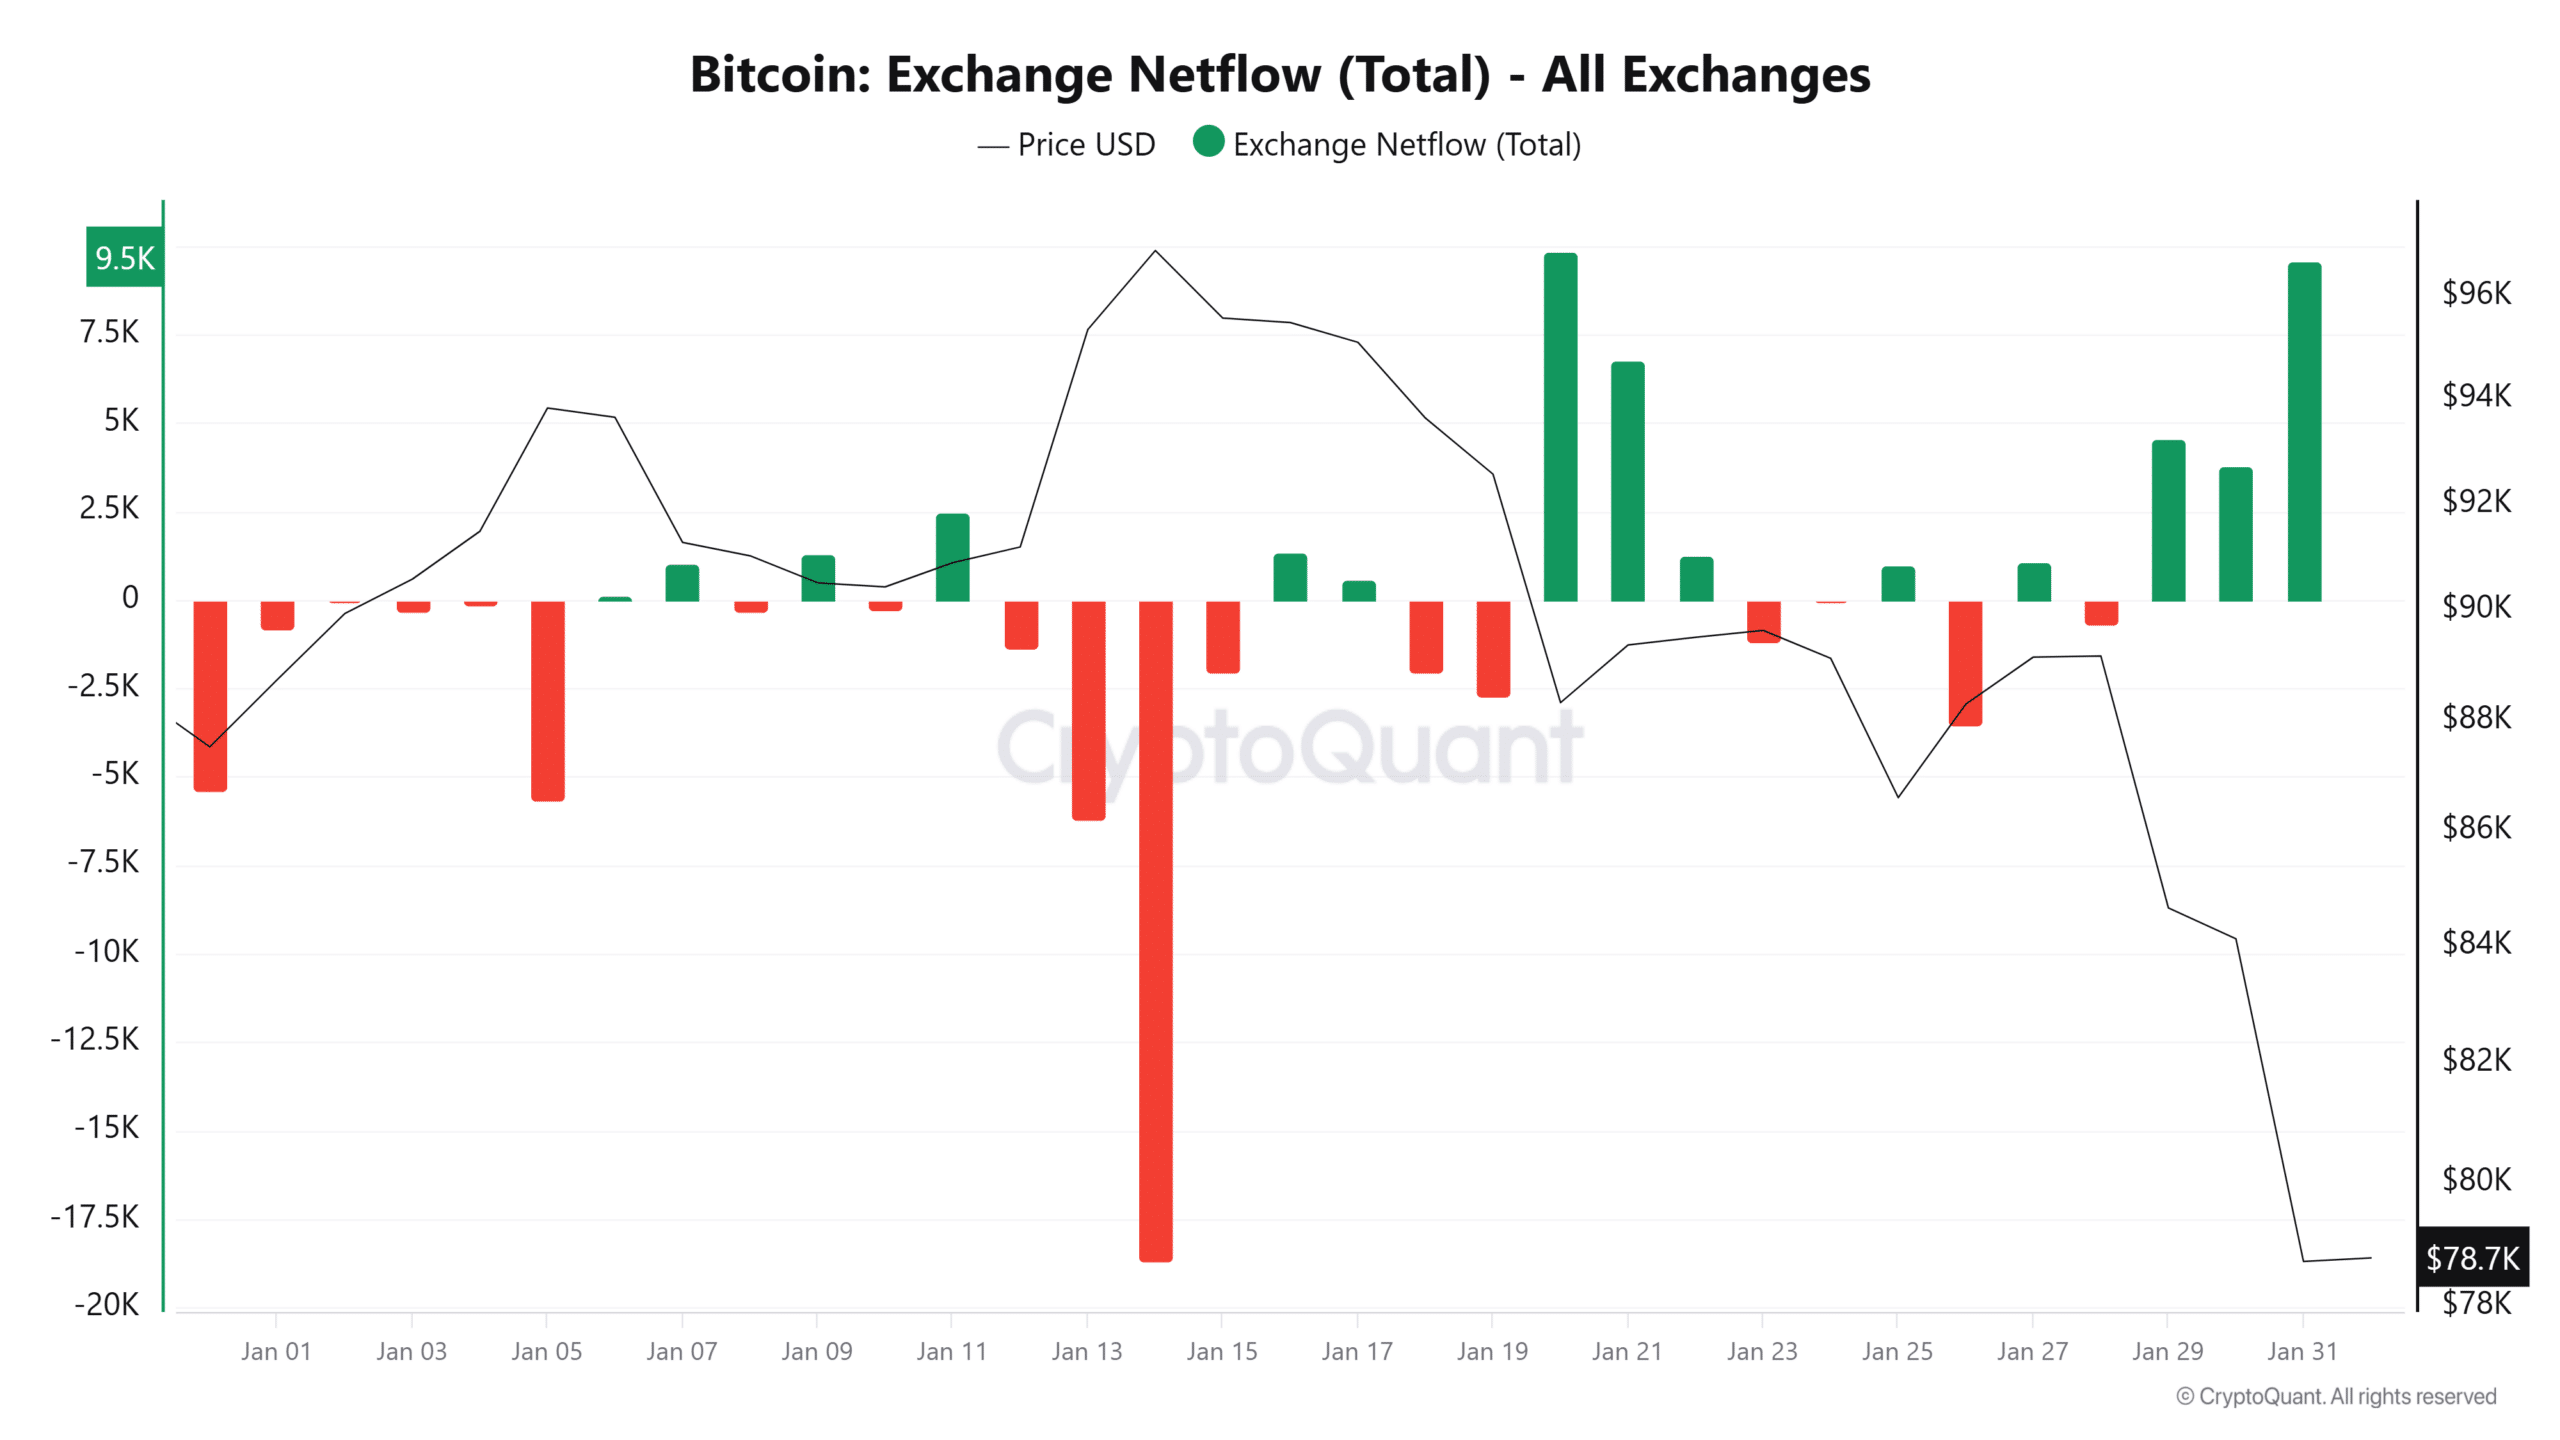
Source: CryptoQuant
At press time, Exchange Netflow was 9.5k BTC, a significant jump from 3.7k BTC from the previous day. Over this period, over 87k BTC was sold on exchanges, a clear sign of aggressive spot dumping.
Is the bottom in yet for BTC?
Bitcoin dropped below $80k, amid a cascade of liquidations. According to CoinGlass, Bitcoin experienced significant liquidation, with $736 million in long positions liquidated.
As a result, downside momentum accelerated as holders panicked and exited the market. As such, Bitcoin’s Stochastic Ergodic Indicator made a bearish crossover and fell deeper into negative territory to -0.46.


Source: TradingView
A dip to such lower levels suggested strong downward momentum, with buyers totally displaced from the market and sellers having total control.
Such market conditions positioned BTC for potentially more losses on its price charts. Thus, if sellers continue to offload, BTC will likely continue to trade below $80k.
Looking at the Future Grand Trend indicator, BTC is positioned for a prolonged period of weakness with $76k as key support. For a bullish case into early February, Bitcoin could jump to $85k to $92k, before retracing again.
Final Thoughts
- Bitcoin [BTC] fell to a 9-month low of $75,519, then rebounded to $78k by press time.
- Bitcoin faced prolonged weakness amid reduced fresh capital inflow and persisting selling pressure.
Source: https://ambcrypto.com/bitcoin-hits-april-2025-levels-85k-bounce-for-btc-possible-if/