After a breakdown of earlier upside momentum followed by a retrace to a low of $2.03, RENDER staged a strong comeback, jumping 22% from a low of $2.2 to a 2-month high of $2.7, rising above the 20-, 50-, and 100-day EMAs.
As of this writing, however, RENDER had retraced, trading at $2.47, up 8.2% on the daily charts. At the same time, its volume climbed 230% to $242 million, reflecting renewed market interest.
Render sees renewed market interest
RENDER’s market participants had turned bearish of late and increased their spending significantly. However, the altcoin saw a shift in sentiment on the 11th of January as buyers returned with conviction to accumulate.
Inasmuch, Accumulation Volume jumped to 13.16 million, while Accumulation/Distribution Volume reached 8.88 million.

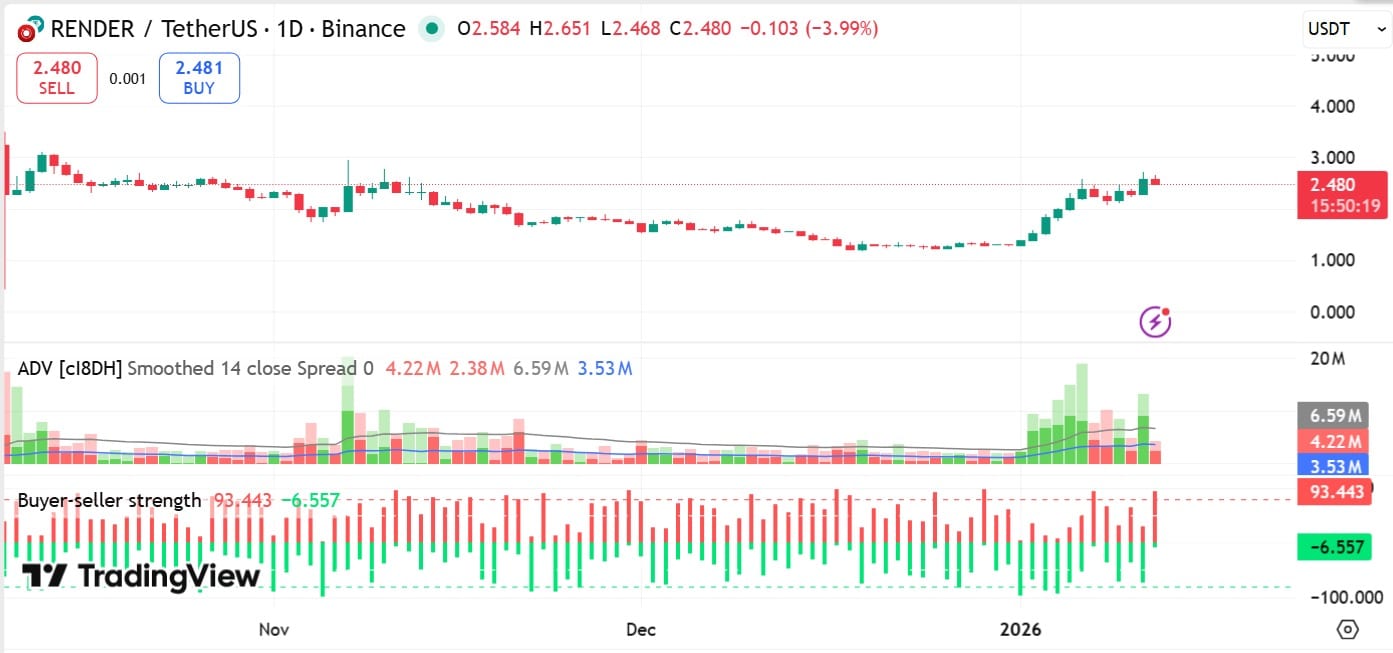
Source: TradingView
This showed buyers’ control of the market, flipping the previous distribution trend. On the 12th of January, accumulation momentum slowed, with ADV dropping 4.22 million, but buyers remained in the market.
The same pattern emerged when AMBCrypto examined the Buyer vs. Seller Strength indicator on TradingView. On the 11th of January, buyers’ strength soared to 70, while sellers’ strength remained low at 29.
On the 12th of January, sellers showed greater conviction, with their strength rising to 93, indicating increased profit-taking. While buyers remain, sellers have also begun to realize profits, potentially threatening upside momentum.
Futures remain highly bullish
Interestingly, while Spot markets showed weakness after RENDER reached a 2-month high, appetite for Futures positions rose even higher.
According to CoinGlass, Derivatives Volume rose 249% to $508 million, while Open Interest climbed 30.96% to $78.43 million.
Usually, when OI and volume rise together, it suggests increased market participation and higher capital flows into Futures.

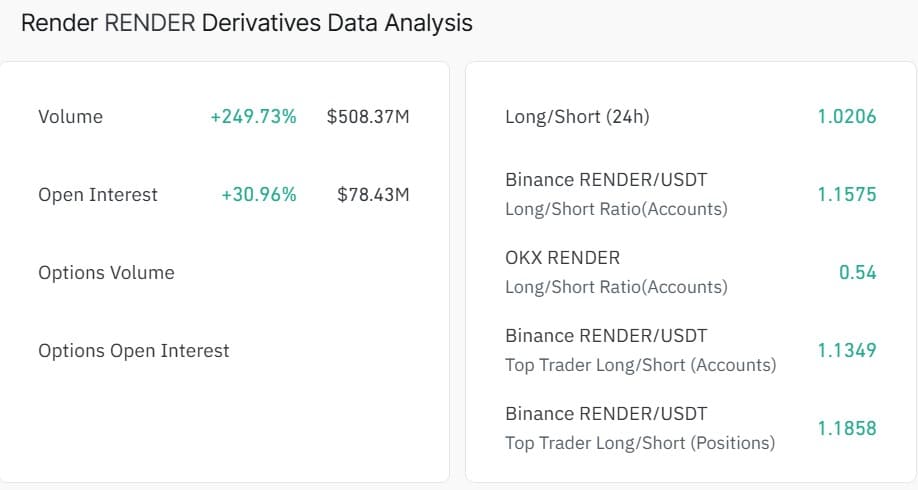
Source: CoinGlass
Inasmuch, RENDER’s Futures Flows surged to $168.55 million compared to $165.05 million in Futures Outflows.
As a result, the Futures Netflow rose 700.26% to $3.5 million, indicating higher demand for Futures positions, whether short or long.

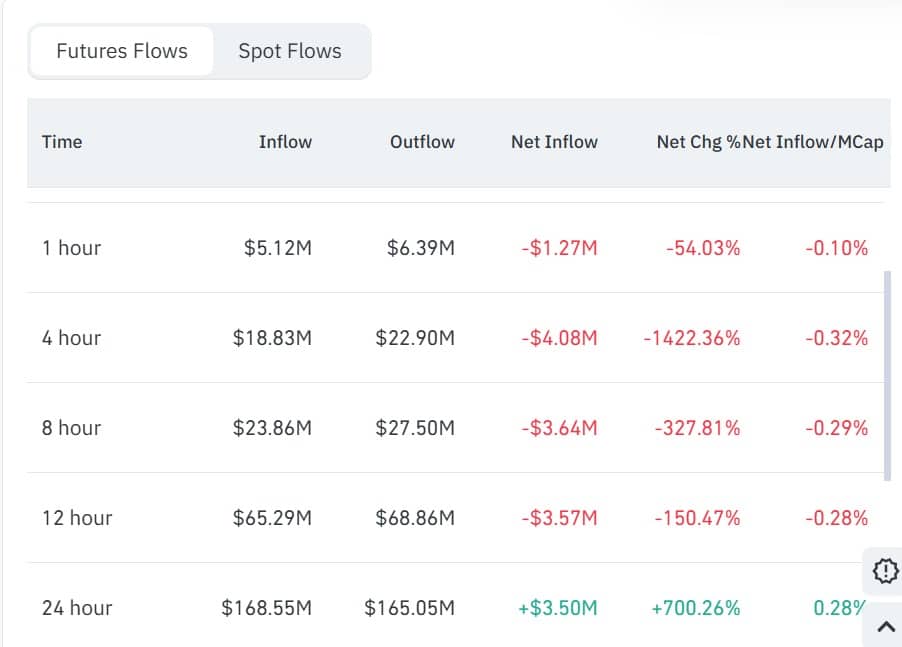
Source: CoinGlass
Meanwhile, altcoin’s Long/Short Ratio rose to 1.02, with traders on Binance leading the way. A ratio above 1 suggested that most of these traders were bullish and took long positions, anticipating higher prices.
What momentum indicators say
RENDER cleared last week’s losses as buyers stepped in across the spot and Futures markets to accumulate. At the same time, it showed weakness as sellers followed suit and started to realize profit.
As a result, the altcoin’s Relative Strength Index (RSI) fell from 75 to 69, indicating rising downward pressure.
Even though this momentum indicator remained within the bullish zone, it suggests that buyers still have the upper hand in the market.

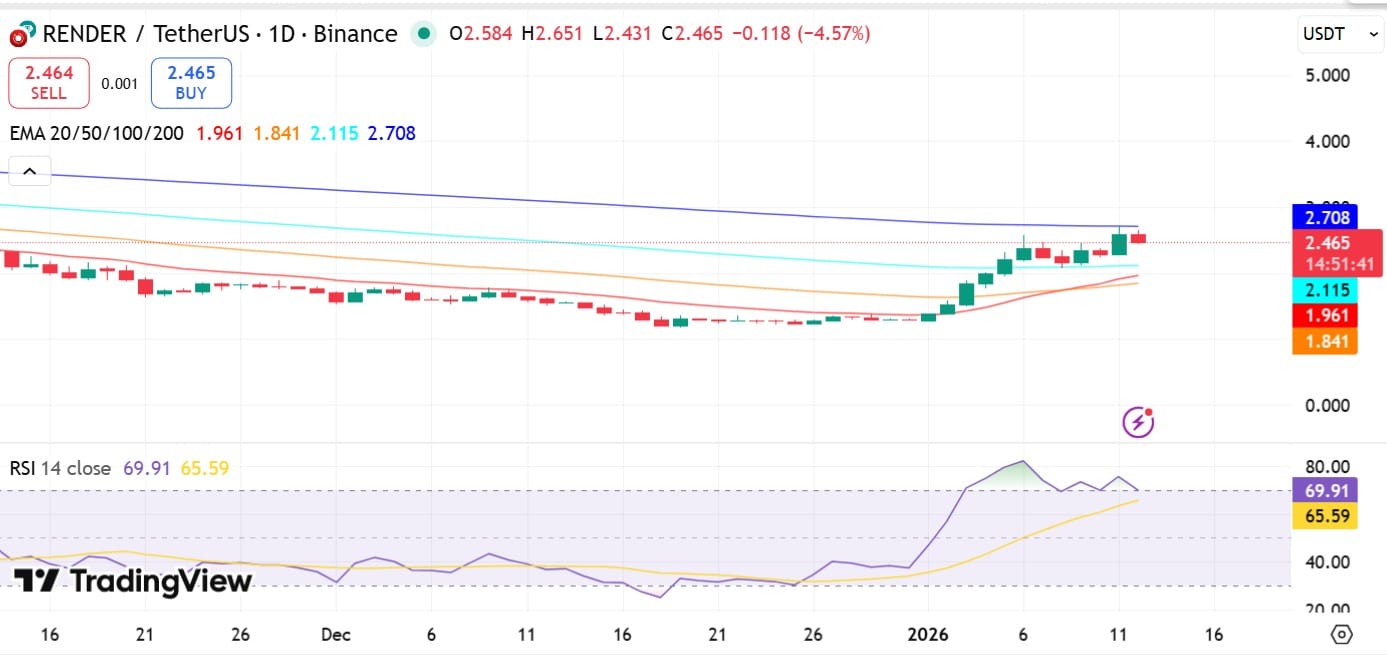
Source: TradingView
The next move depends on which side wins this tug-of-war. If buyer’s momentum holds and rises again, RENDER will successfully retest EMA200 at $2.7 and target $3.5 resistance.
However, if sellers are increasingly active and their spending overwhelms the market, RENDER will fall back to $2.1.
Final Thoughts
- Render [RENDER] jumped to a 2-month high of $2.7 and then retraced to $2.47 at press time.
- RENDER saw renewed demand across the spot and Futures markets, but sellers increased spending, threatening recent gains.
Source: https://ambcrypto.com/render-can-rise-to-3-5-or-fall-to-2-1-where-will-price-go/