Solana price is showing a positive recovery, maintaining levels above $130, driven by growing momentum. This upward trend is signaling potential for further gains. The recovery of Solana has been noted despite a 4% decline in the past 24 hours because of an increase in short-position liquidations and a favorable adoption announcement.
The wider cryptocurrency space has been under strain too, with Bitcoin price hovering under $90k. Analysts expect that Solana has a potential of going between $150-$160 over 2-4 weeks, as long as the current consolidation phase persists.
Solana Spot ETFs See Significant Inflows on December 5, 2025
On December 5, 2025, SoSoValue reported a total net inflow of $15.68 million USD for Solana’s spot ETFs. This is an indication of high interest in Solana-based investment products. Bitwise SOL ETF (BSOL) had the largest single-day inflow of any of these, of $12.18 million USD.
The total historical flow of BSOL finally reached 593 million USD. This emphasizes its growing popularity and the good performance in the market. The popularity of the ETF highlights the investor confidence in the Solana blockchain ecosystem. Consequently, it still draws considerable amounts of capital.
吴说获悉,据 SoSoValue 数据,美东时间 12 月 5 日,Solana 现货 ETF 总净流入 1568 万美元。昨日单日净流入最多的 SOL 现货 ETF 为 Bitwise SOL ETF BSOL,单日净流入 1218 万美元,目前 BSOL 历史总净流入达 5.93 亿美元。其次为 Fidelity SOL ETF FSOL,单日净流入为 349… pic.twitter.com/3ox8GHSB9A
— 吴说区块链 (@wublockchain12) December 6, 2025
Then, the Fidelity SOL ETF (FSOL) registered a net inflow of 3.49 million USD in the same day. Small, but this is an indicator of growing investor interest in ETFs backed by Solana. The BSOL and FSOL have raised some interest as some of the possible good investment opportunities in the cryptocurrency market.
These values demonstrate that the demand towards Solana-related financial products is growing. Solana ETFs are also a great choice because more investors are willing to enter the digital asset opportunities. They are likely to keep attracting performance in the market at large.
Is Solana Price Heading Toward $150 or a Downturn?
As of the reporting, the SOL price is currently at $132. The Solana market has shown a slight decline of 0.05%, with the price hovering around the $132 range.
The MACD line of -1.01, which was below the signal line of 0.07, indicates a bearish mood. Solana has a Relative Strength Index (RSI) of 37, which is close to the neutral zone.
For immediate targets, the market will be closely watching key levels as the full Solana forecast report. On the upside, the first resistance for Solana is at $140. If the price breaks above this level, it could move toward the next resistance at $150. A successful break of the $150 resistance could open the door for a potential rally toward $160.
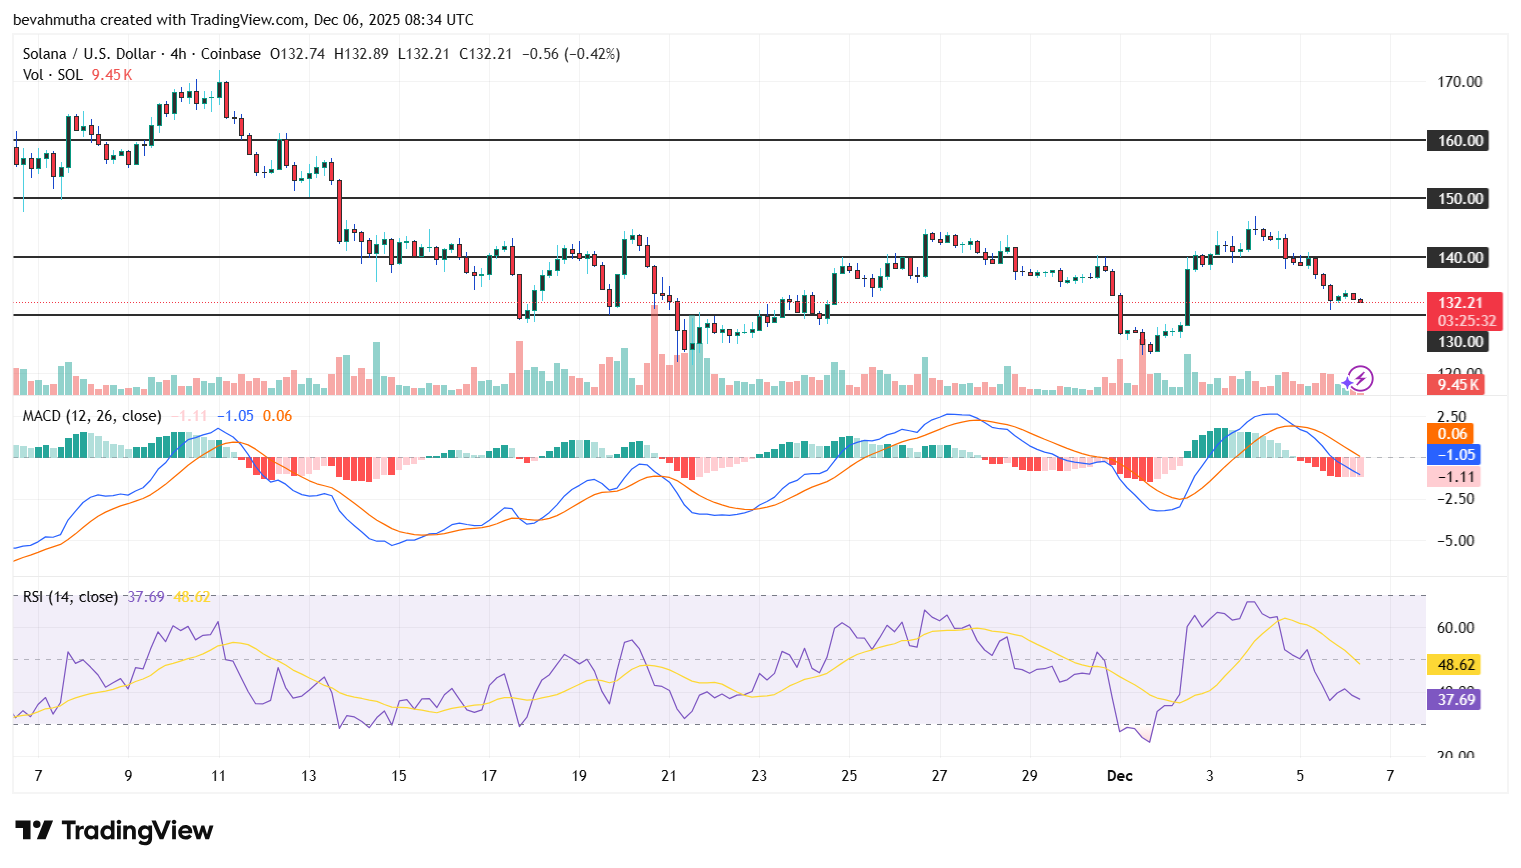

Nevertheless, in case the Solana price finds it difficult to overcome the $140 resistance, Solana might experience a pullback.
The support is seen at the immediate level of about $130. Further weakness may be triggered by a fall below $130, with the second support point at $120.