heThe Bitcoin price keeps pushing toward deeper zones as sellers test pockets near $92K. The BTC price recently traded close to $95K, and this region now shows hesitation because buyers avoid aggressive action. The Bitcoin Fear and Greed Index also reached new lows and this change places further strain on short-term sentiment.
Investors are now responding with caution since the volatility increases and the expectation of a Fed rate cut is diminished. The behavior of the price around the lower band is of interest to the analysts. This is because the liquidity accumulates around the lower band. The same area is also pressed by technical structures, which form one decisive zone.
Top Analysts Warn of a Sweep Into the $92K Zone
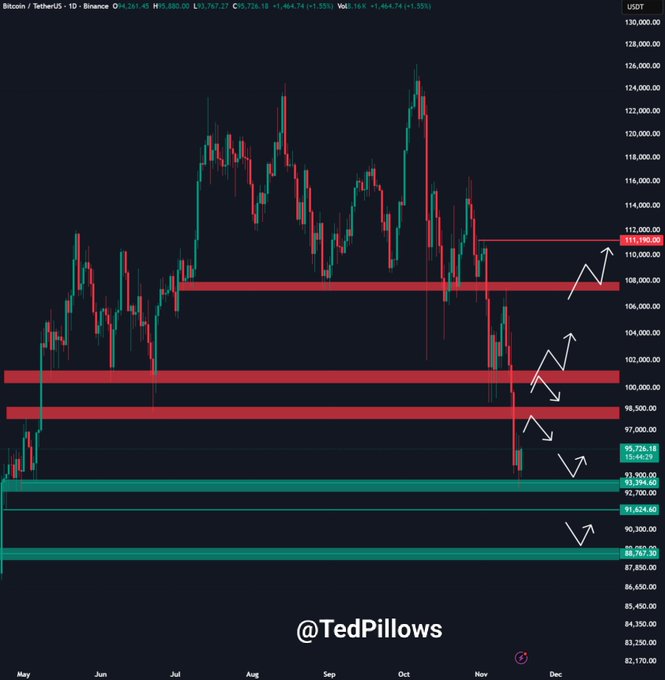
According to Ted, the Bitcoin price holds room for a final dip because the $92K CME gap remains untouched and continues to attract interest. As per his set-up, clean imbalances are frequently re-experienced when the market develops tension in the price between supports, particularly around $93K and $95K.
Meanwhile, the current Bitcoin value sits close to $95K, a level showing hesitation as buyers avoid aggressive moves. Ted also highlights $98K as the key reclaim zone because reactions there usually confirm a shift in short-term strength.
He considers the fall to $92K as operational instead of risky because liquidity is more effectively cleared in small falls. This opinion is the basis of the larger argument since it presents the lower zones as key components of the subsequent large response.

Additionally,
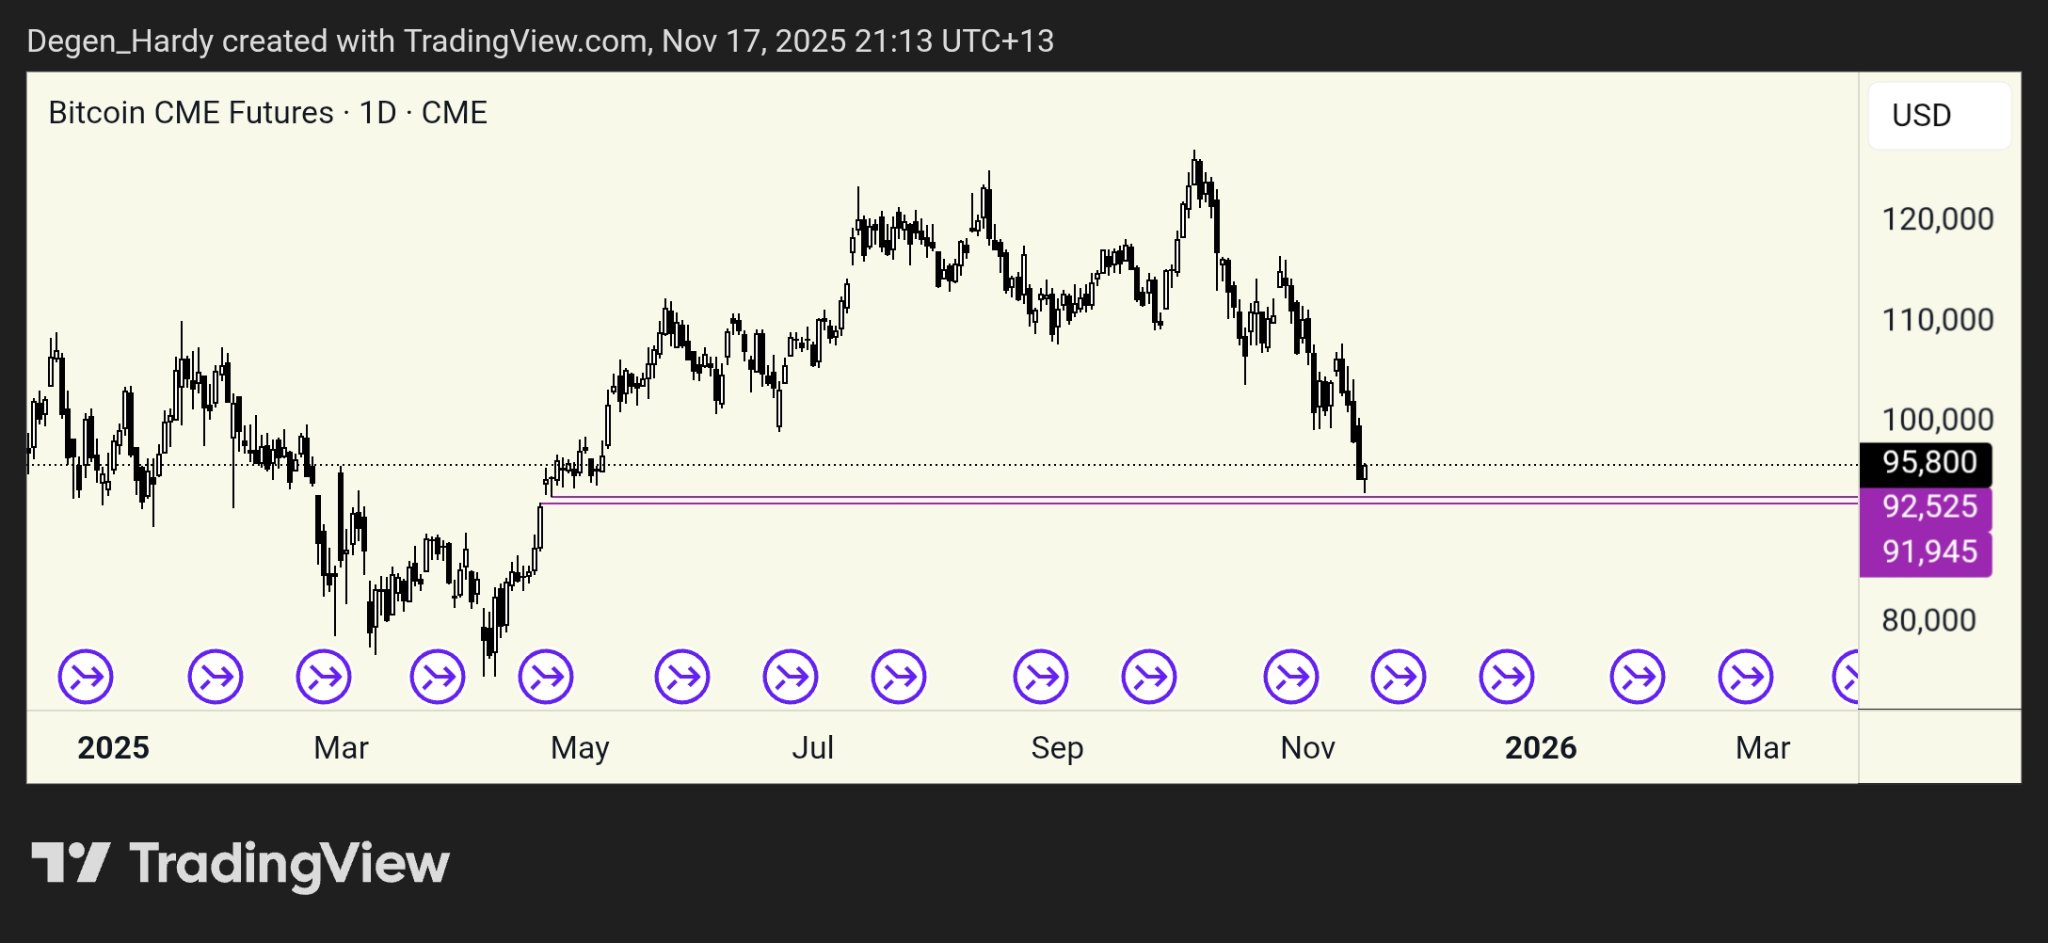
Hardy builds on Ted’s perspective and points directly to the gap between $91.9K and $92.5K. He describes this gap as the strongest magnet on the chart in his X post. Notably, whales choose precise fills in this band because these pockets give cleaner execution with minimal distortion.
The expert views the structure as controlled because price respects earlier reaction levels near $95K and $97K. The BTC price sits slightly above the gap, which leaves enough space for a final extension into the zone.
The analyst expects a sharp reversal after this sweep because liquidity held below $92K often fuels rapid reaction moves. He believes that a decisive sweep through the $92K region can complete the reset the market now seeks.

Key Structures Align Near $93K to Shape the Long-Term BTC Outlook
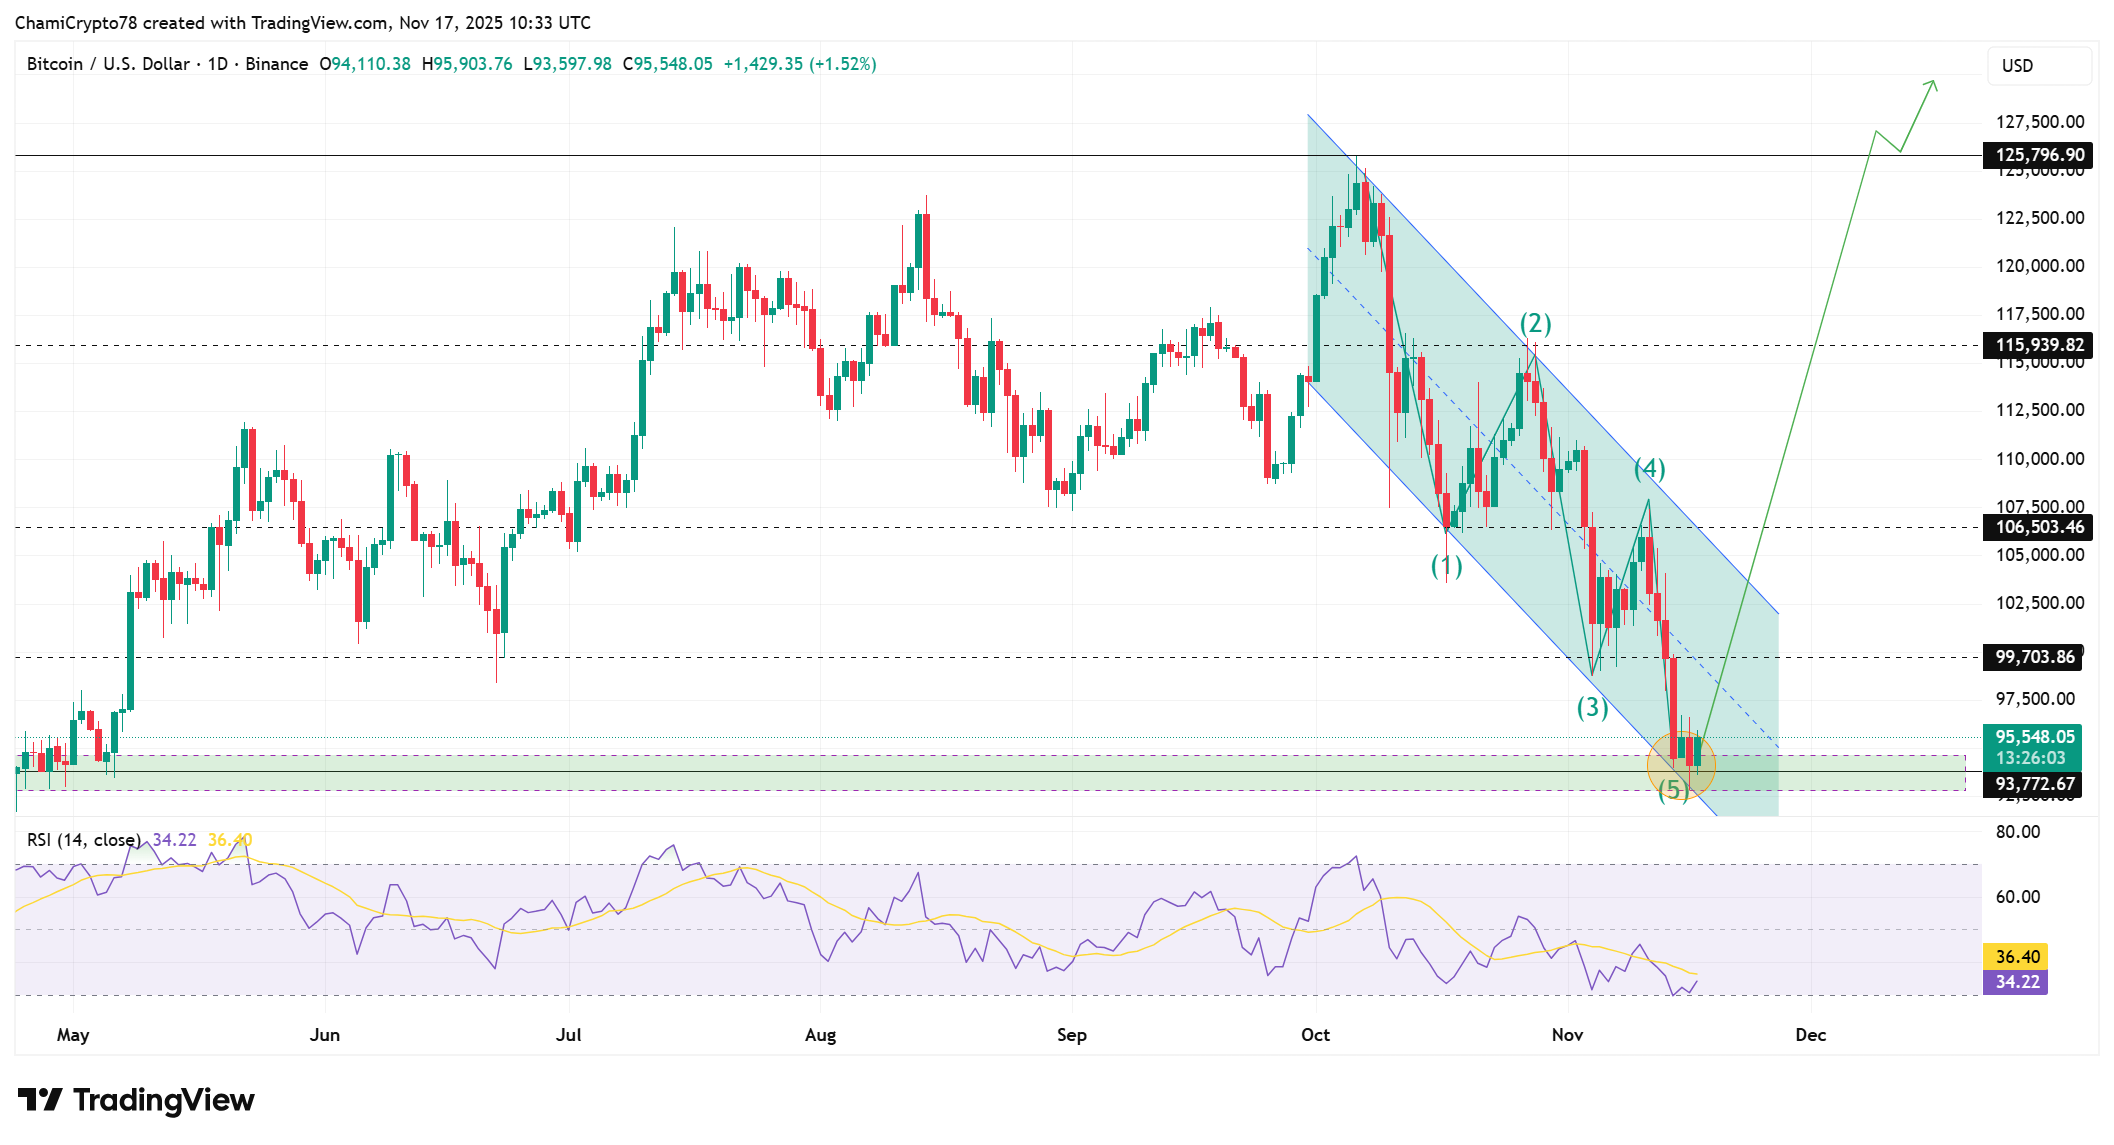
Several technical structures converge near the same region highlighted by analysts, strengthening the broader setup. Bitcoin now interacts with the lower boundary of its descending channel, and that support sits between $93K and $94K.
The BTC price has tapped this level several times, and each rejection shows buyers defending the band. The Elliott impulse wave also completes its fifth leg near this support. The sequence usually signals exhaustion after extended selling, with the new BTC model projecting $200k in 12 months .
The proximity of the $91.9K–$92.5K gap fits perfectly within this structure because full exhaustion usually appears when liquidity clears below major supports.
Additionally, the RSI is now approaches oversold territory. The alignment often sparks early rebound attempts near strong floors. Together, these signals strengthen the long-term BTC price outlook because the structural zone between $91.9K and $94K carries everything needed for a strong recovery attempt.

Conclusively, Analysts believe the Bitcoin price might explore the $91.9K–$93K area, highlighting it as a zone that could influence the next move. A controlled sweep may complete the last leg before buyers attempt a reaction. Price structure, liquidity and momentum all meet at this pocket. These elements provide an environment that may help in a significant recovery after the sweep is over.
Source: https://coingape.com/markets/top-analysts-predict-how-low-bitcoin-price-might-fall/