FLOKI continues to face downward pressure, with price action consolidating around the critical $0.000062 support level.
The recent pullback reflects broader weakness across the meme coin segment, but technical indicators suggest that selling momentum could be easing as market participants begin repositioning after an extended decline.
Drop in Open Interest and Slowing Momentum
Market data shows a notable contraction in aggregated open interest (OI) — from above 4.8 million to approximately 3.27 million. This drop indicates a significant liquidation of leveraged positions, as traders reduce exposure amid heightened uncertainty. Such a decline during a price downtrend often reflects long positions being flushed out, leaving the market in a cleaner state for potential recovery.

Source: Open Interest
The combination of lower OI and stable price movement often precedes a shift in market structure. Analysts note that if FLOKI maintains price stability above $0.0000620 while OI begins to climb again, it could signal a renewed bullish phase. However, failure to attract fresh participation may see price drift toward deeper supports near $0.0000580 before any recovery effort.
Overall, the market appears to be in a transition phase — shifting from speculative excess toward a more measured accumulation environment.
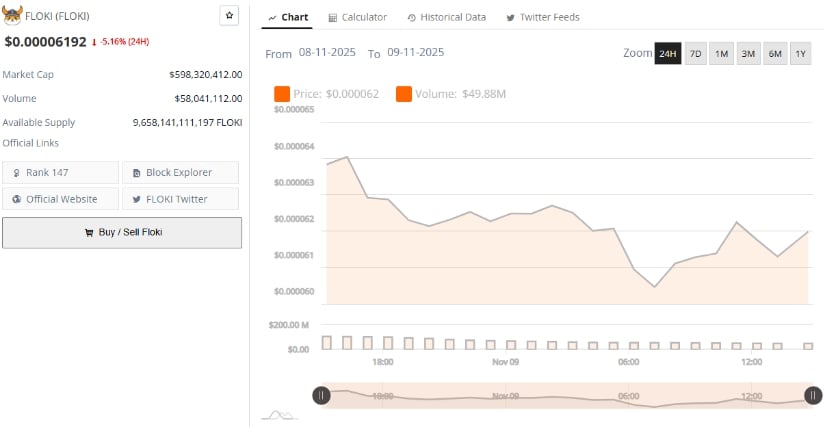
Market Data: FLOKI Down 5.16% as Market Cap Nears $600 Million
According to BraveNewCoin, the coin is priced at $0.00006192, marking a 5.16% decline over the past 24 hours. The project’s market capitalization stands at $598.32 million, with a 24-hour trading volume of $58.04 million. Its circulating supply is approximately 9.65 trillion tokens, ranking it 147th globally by market cap.
Source: BraveNewCoin
The data confirms that the asset remains in a broad corrective structure following weeks of volatility. Despite this, liquidity levels remain strong, and the price continues to consolidate within a defined range — a sign that sellers may be losing strength as the market seeks equilibrium.
Technical View: Near Lower Bollinger Band with Bearish Bias
TradingView analysis shows FLOKI/USDT hovering around $0.00006178, trading near the lower Bollinger Band ($0.0000565) after failing to sustain movement above the midline. This positioning indicates that sellers still dominate short-term action, although repeated touches at the lower band without breakdowns often precede a base formation.

Source: TradingView
The Bollinger Bands remain relatively wide, implying elevated volatility, yet their recent narrowing suggests that momentum may be stabilizing. A close above the middle band ($0.0000680) would mark an early sign of bullish reversal potential, opening the path toward $0.0000795 (upper band resistance).
From a capital flow standpoint, the Chaikin Money Flow (CMF) reads -0.12, showing that outflows continue to outweigh inflows. Buyers remain tentative, but a cross above the zero line alongside an uptick in trading volume would validate renewed accumulation.