- The Bitcoin price correction is 5% short of testing a major support, expanding the channel pattern.
- Derivatives data show a cooling speculative environment among traders.
- The BTC fear and greed index, down to 42%, indicates that the market sentiment is turning bearish.
The pioneer cryptocurrency, Bitcoin, was painted red on Monday, recording an intraday loss of 3.39% and currently trading at $106,740. ETF outflows, leveraged long liquidations, and technical breakdowns are among the key contributors to the recent downswing. As bearish momentum mounts, the Bitcoin price is heading for another breakdown, as several on-chain indicators suggest the correction could persist in the near future.
BTC Drops Below $106K as On-Chain Data Signals Ongoing Correction Phase
Today’s decline saw Bitcoin drop nearly 5% to a low of $105,300 before recovering to $106,740. The bearish momentum spread across the crypto market triggered a total liquidation of $1.23 billion across 325,029 traders in the last 24 hours, according to Coinglass data.
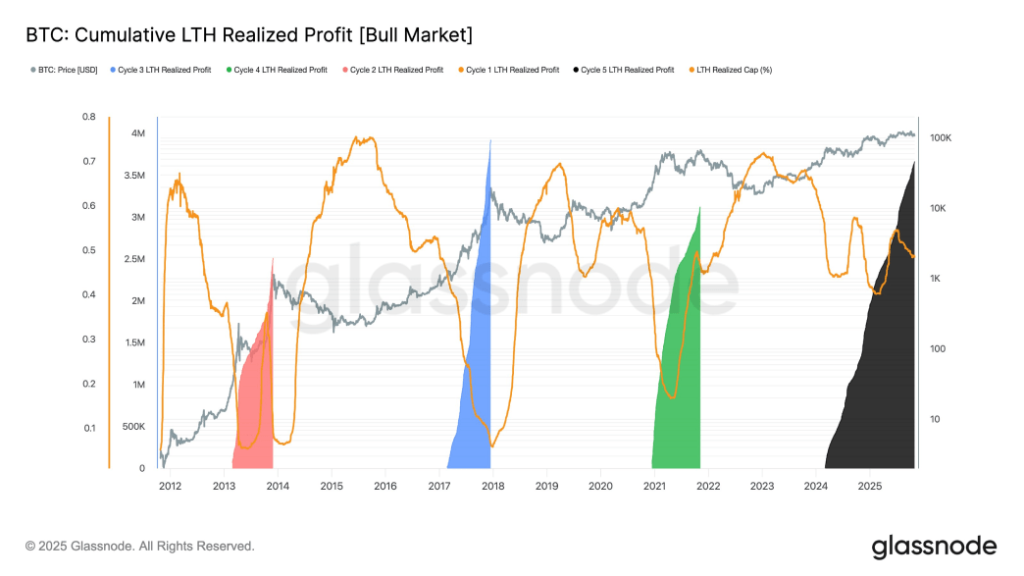
As BTC is declining toward the $100K mark, Glassnode senior researcher CryptoVizArt tweeted a list of on-chain indicators, pointing out that the correction phase has more room to continue. The chart below shows long-term holders have already locked in profits of nearly 3.67 million BTC since this cycle’s peak—a staggeringly large realization in comparison to the previous market tops, implying that a pretty large chunk of veteran investors started offloading early in the rally.
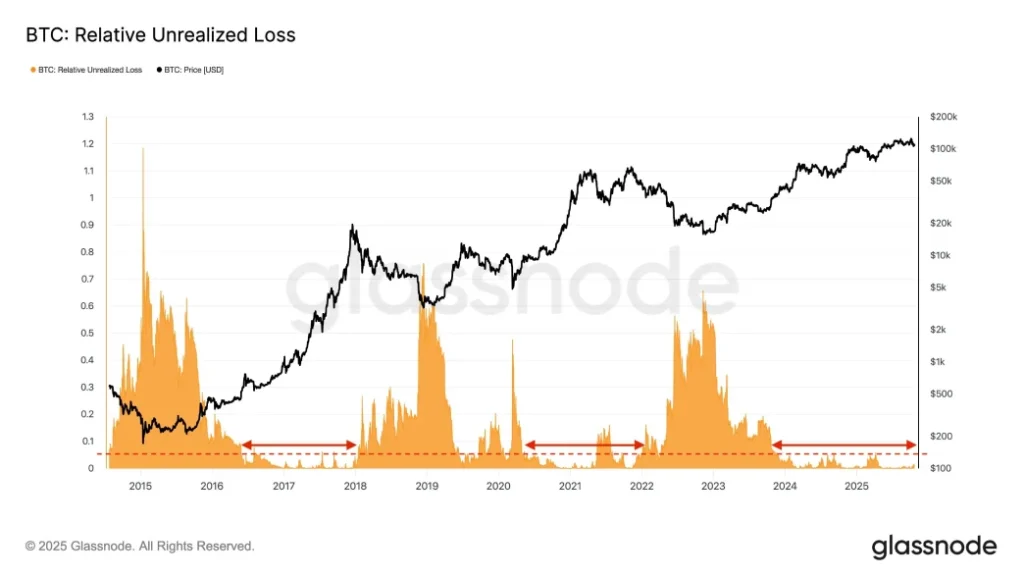
An analysis of unrealized losses throughout the network demonstrates that even with the recent dip to around $107,000, the hold of coins at a loss as a percentage of Bitcoin’s market cap is very low at 1.3%. Historically, readings below 5% are concomitant with bullish phases, and deeper contractions can see the ratio rise above 50%. The relatively contained loss level suggests that wider market capitulation has not yet taken place.
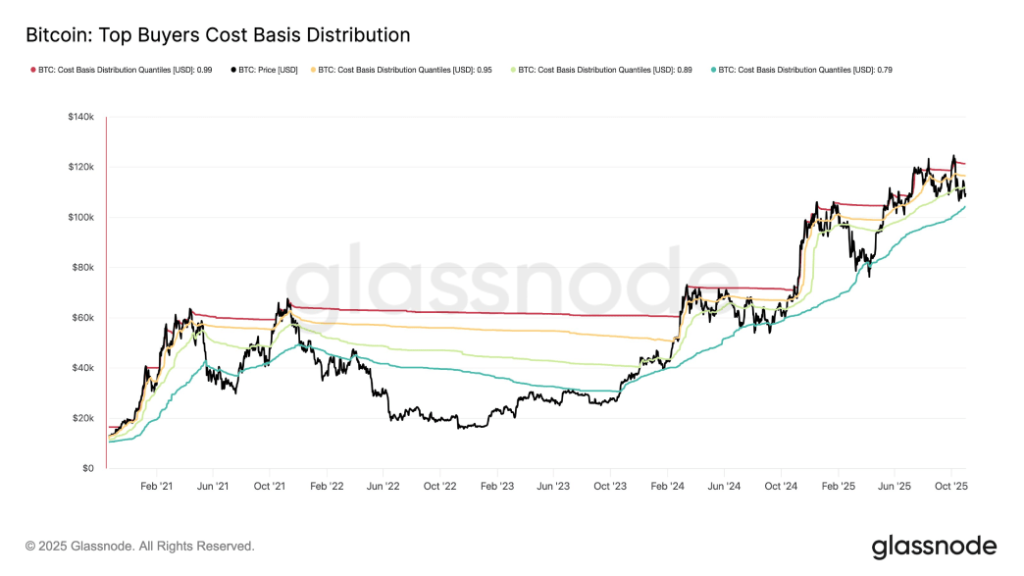
Another measure that tracks investor positioning shows that since July, Bitcoin has been consistently trading below the average acquisition cost of the top 1%, 5%, and 10% of the coin supply. This pattern is indicative of high-cost buyers steadily exiting, leaving holdings to newer participants who are willing to accumulate through volatility. Analysts say that another 80% supply quantile cost basis revisit may be a further redistribution before stability returns.
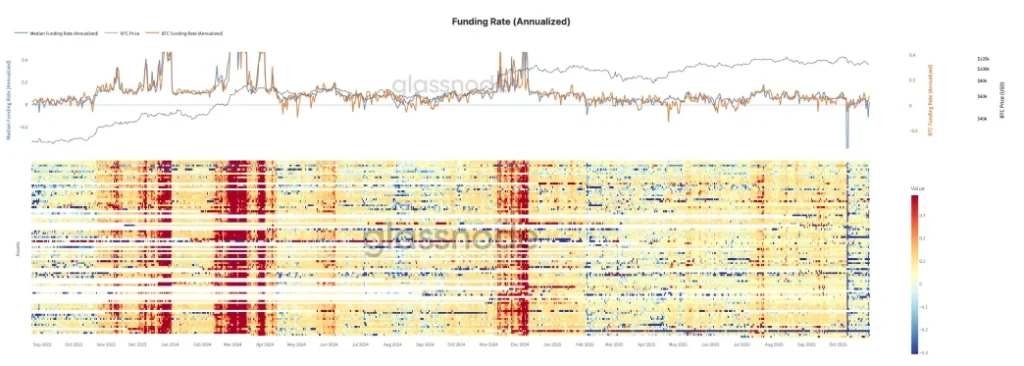
Meanwhile, derivatives data show a cool-off period among market speculators. The run-up to $126,000 earlier in the year was not accompanied by the heavy leveraging activity that we usually see at cycle peaks. Since the October 10 “Black Friday” market reset, perpetual funding rates have been coming off, highlighting declining enthusiasm for aggressive long exposure among traders.
Taken together, the data paint a picture of a market that is still in transition—with long-term holders offloading profits, speculative excess has been squeezed out, and conviction is quietly shifting to new hands. The lack of a major washout is a sign that the current correction may not so much be a result of panic but a result of the slow recalibration of market ownership.
Bitcoin Price Nearing a Make-or-Break Floor
For the past four weeks, the Bitcoin price has been traveling in a sideways trend within the formation of an expanding channel pattern, also called a megaphone. The chart setup is characterized by two diverging trendlines, which create higher price swings in each cycle, indicating increasing market uncertainty.
With today’s downtick, the Bitcoin price is just 4.8% short of retesting the pattern’s bottom trendline at the $102,000 mark. The potential retest would be a pivot level for BTC. The recent price behavior on the pattern shows that the bottom trendline has been acting as a strong accumulation point for traders during the market pullback.
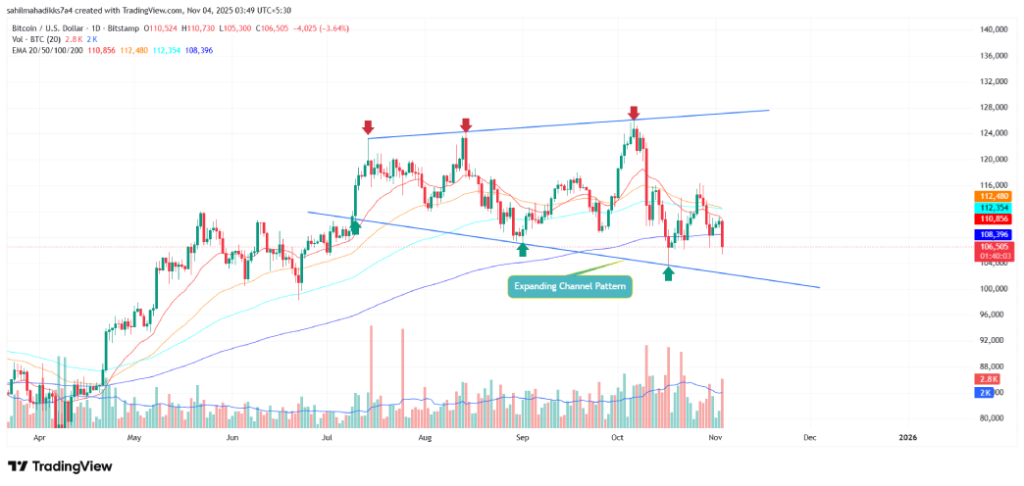

If history repeats, the coin price could recoup the exhausted bullish momentum for a potential rebound. On the contrary, a breakdown below the bottom trendline will intensify the selling pressure and drive a prolonged correction below the $100,000 mark.
Also Read: Hyperunit Whale Deploys $55M Long on Bitcoin and Ethereum
Source: https://www.cryptonewsz.com/bitcoin-price-100k-chain-hint-more-pain-ahead/
