HBAR price has formed a bullish flag pattern on the daily chart. Hedera has moved to the second phase of the Elliot Wave, pointing to a rebound ahead of the HBAR ETF approval. However, the falling stablecoin and ecosystem growth presents a major risk.
HBAR Price Bullish Flag Points to a Rally
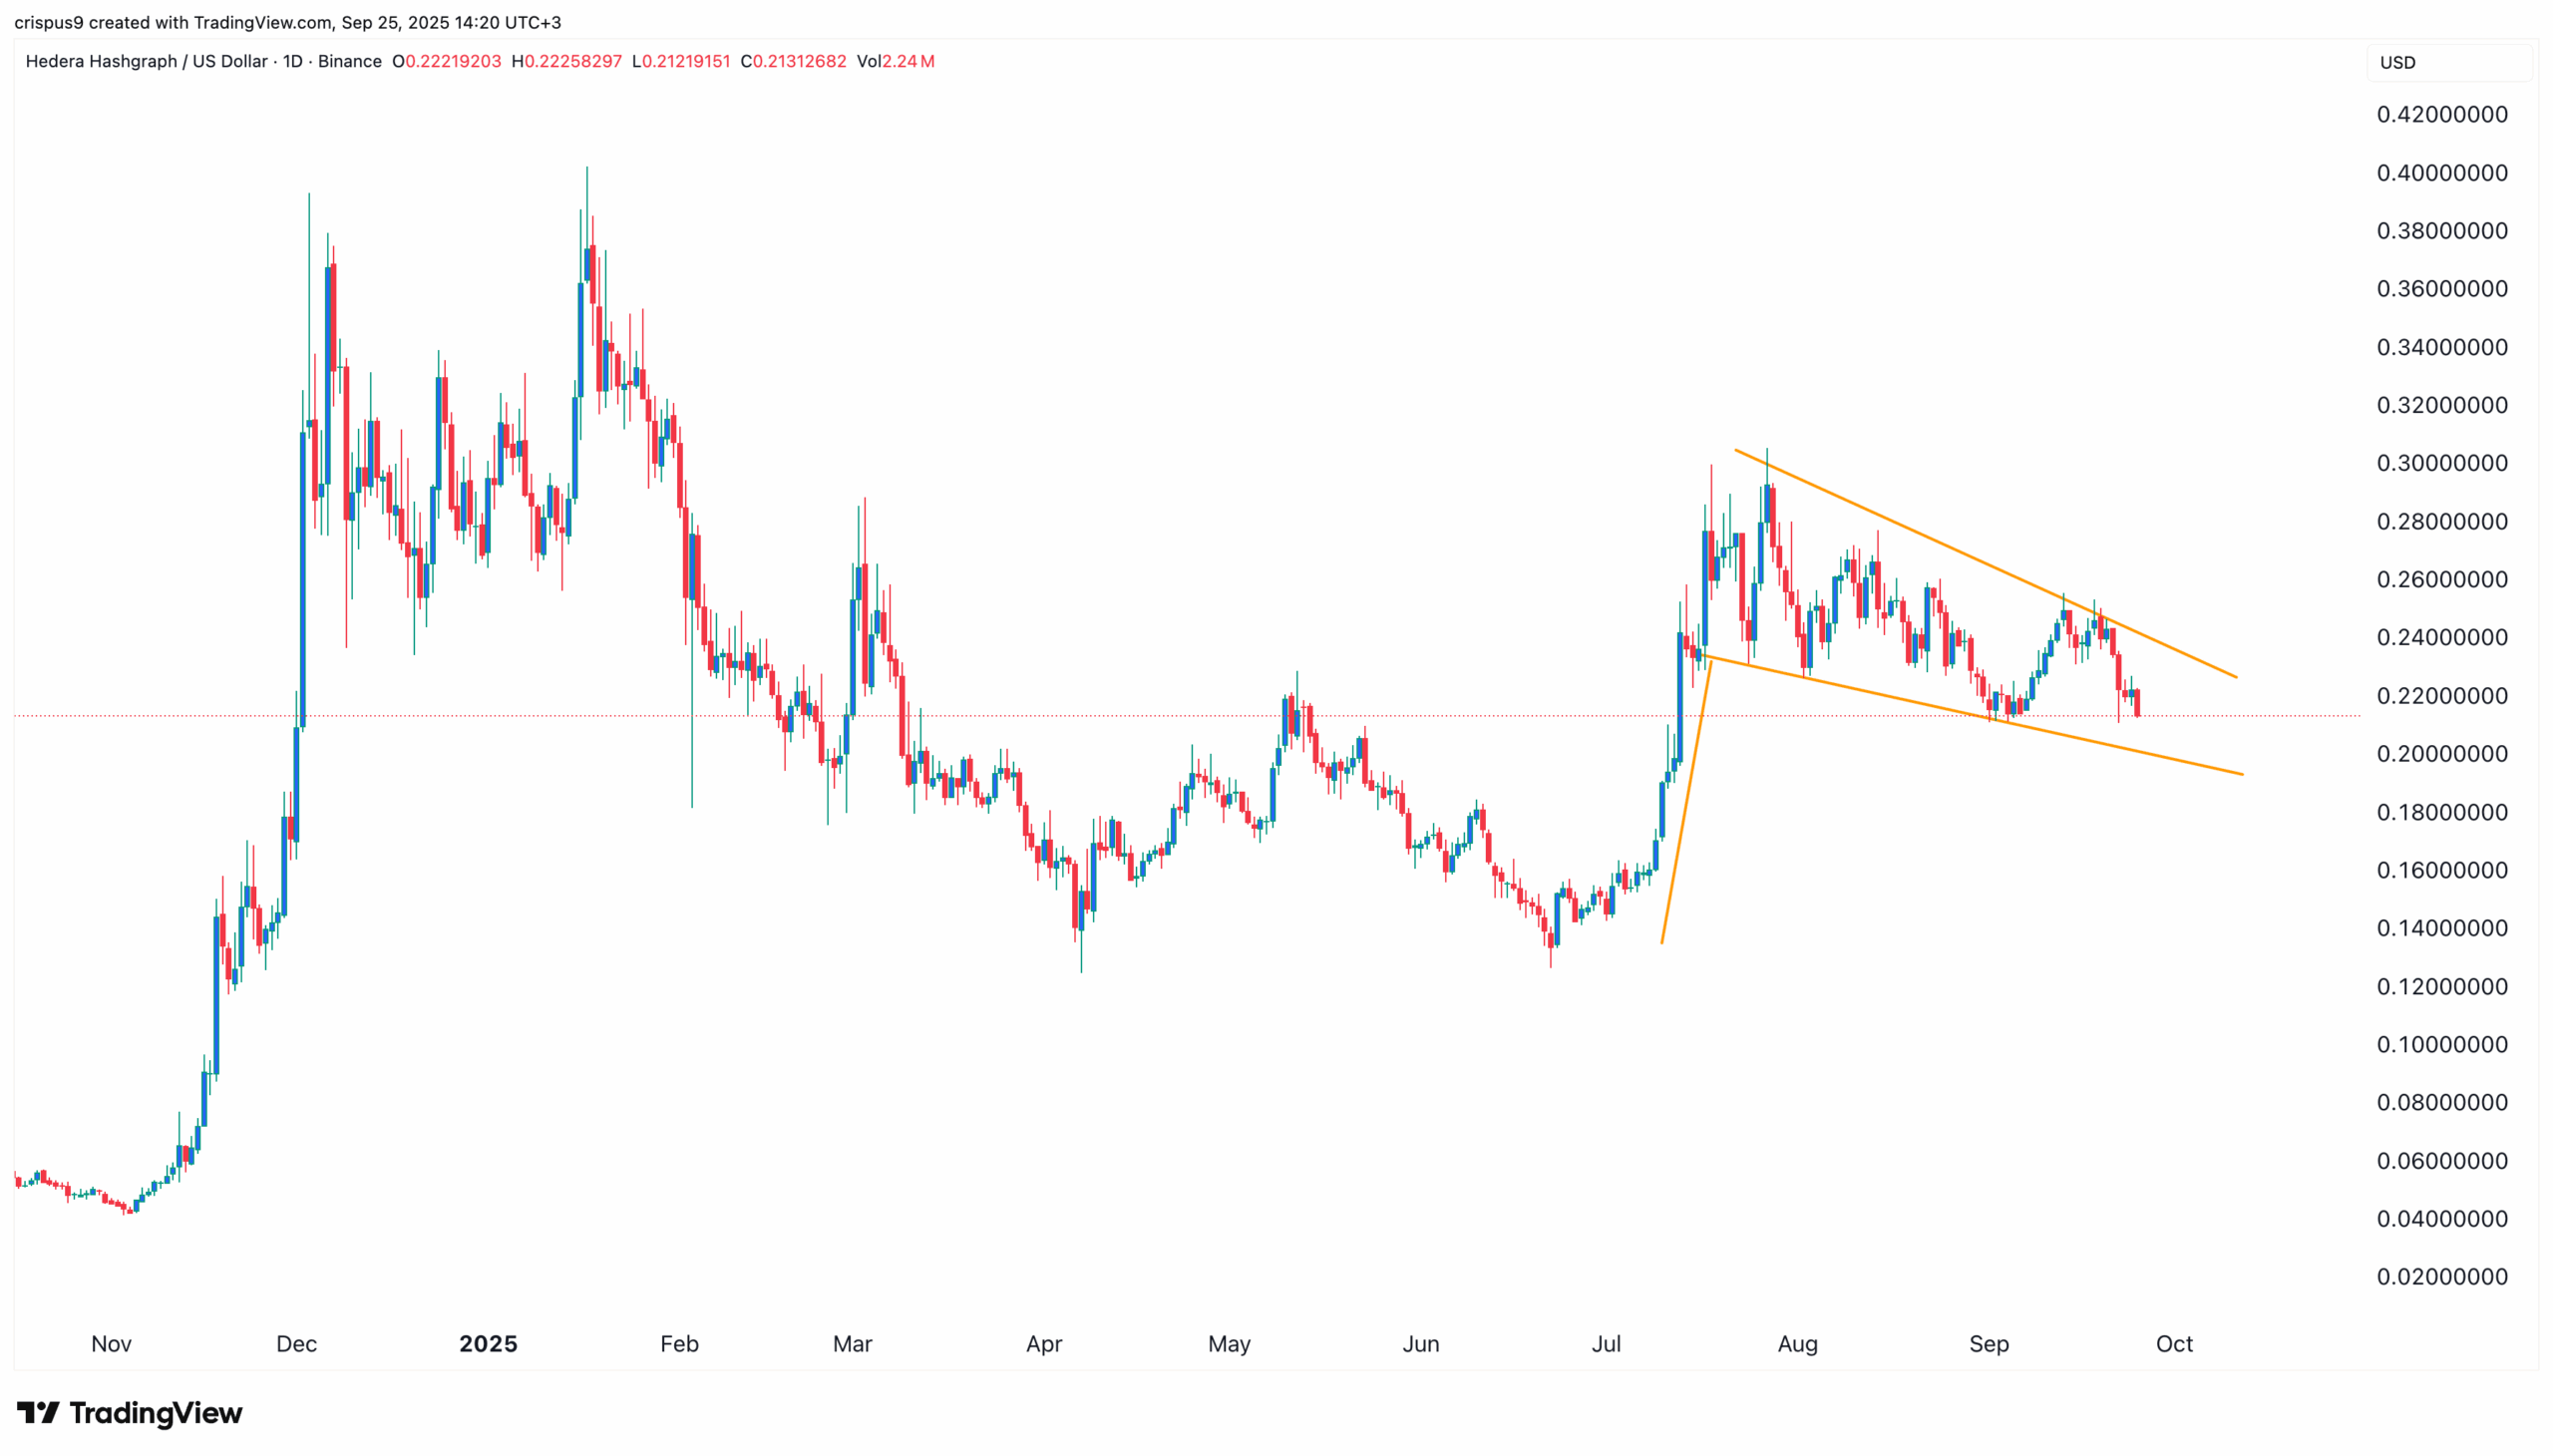
The daily timeframe chart shows that the HBAR price could be on the cusp of a strong bullish breakout. The first main positive sign is that the coin is slowly forming a bullish flag pattern.
It formed the flag section between June 22nd and July 28 as it moved from a low of $0.1230 to a high of $0.3055. The coin has formed a descending channel, which is part of the flag section. In most cases, this pattern leads to a strong bullish flag chart pattern.
The profit target in a bullish flag or a pennant is estimated by first calculating the distance of the flagpole. In this case, this distance is about 60%. One then measures the same distance from the breakout point. In this case, such a move points to a rally to $0.3800.

Hedera Price Elliot Wave Analysis and Double-Bottom
HBAR crypto has other bullish signs. The first one is that it has remained above the 200-day Exponential Moving Average (EMA), which has provided it with substantial support.
Another bullish aspect is that the coin formed a double-bottom pattern at $0.1230. This is a common bullish reversal pattern comprised of two distinct lows and a neckline, which in this case, is at its May high of $0.2262.
HBAR price has made a break-and-retest pattern by falling back to the neckline. This break-and-retest pattern normally confirms a bullish breakout.
Additionally, there are signs that the coin is now in the second phase of the impulsive Elliot Wave. This phase is characterized by a pullback, which is between 50% and 61.8% retracement of the first wave.
It is then followed by the third wave, which is normally the most bullish. If this happens, the next point to watch will be last year’s high of $0.40, which is about 86% above the current level. A drop below the 200-day moving average will invalidate the bullish Hedera price forecast 2025.
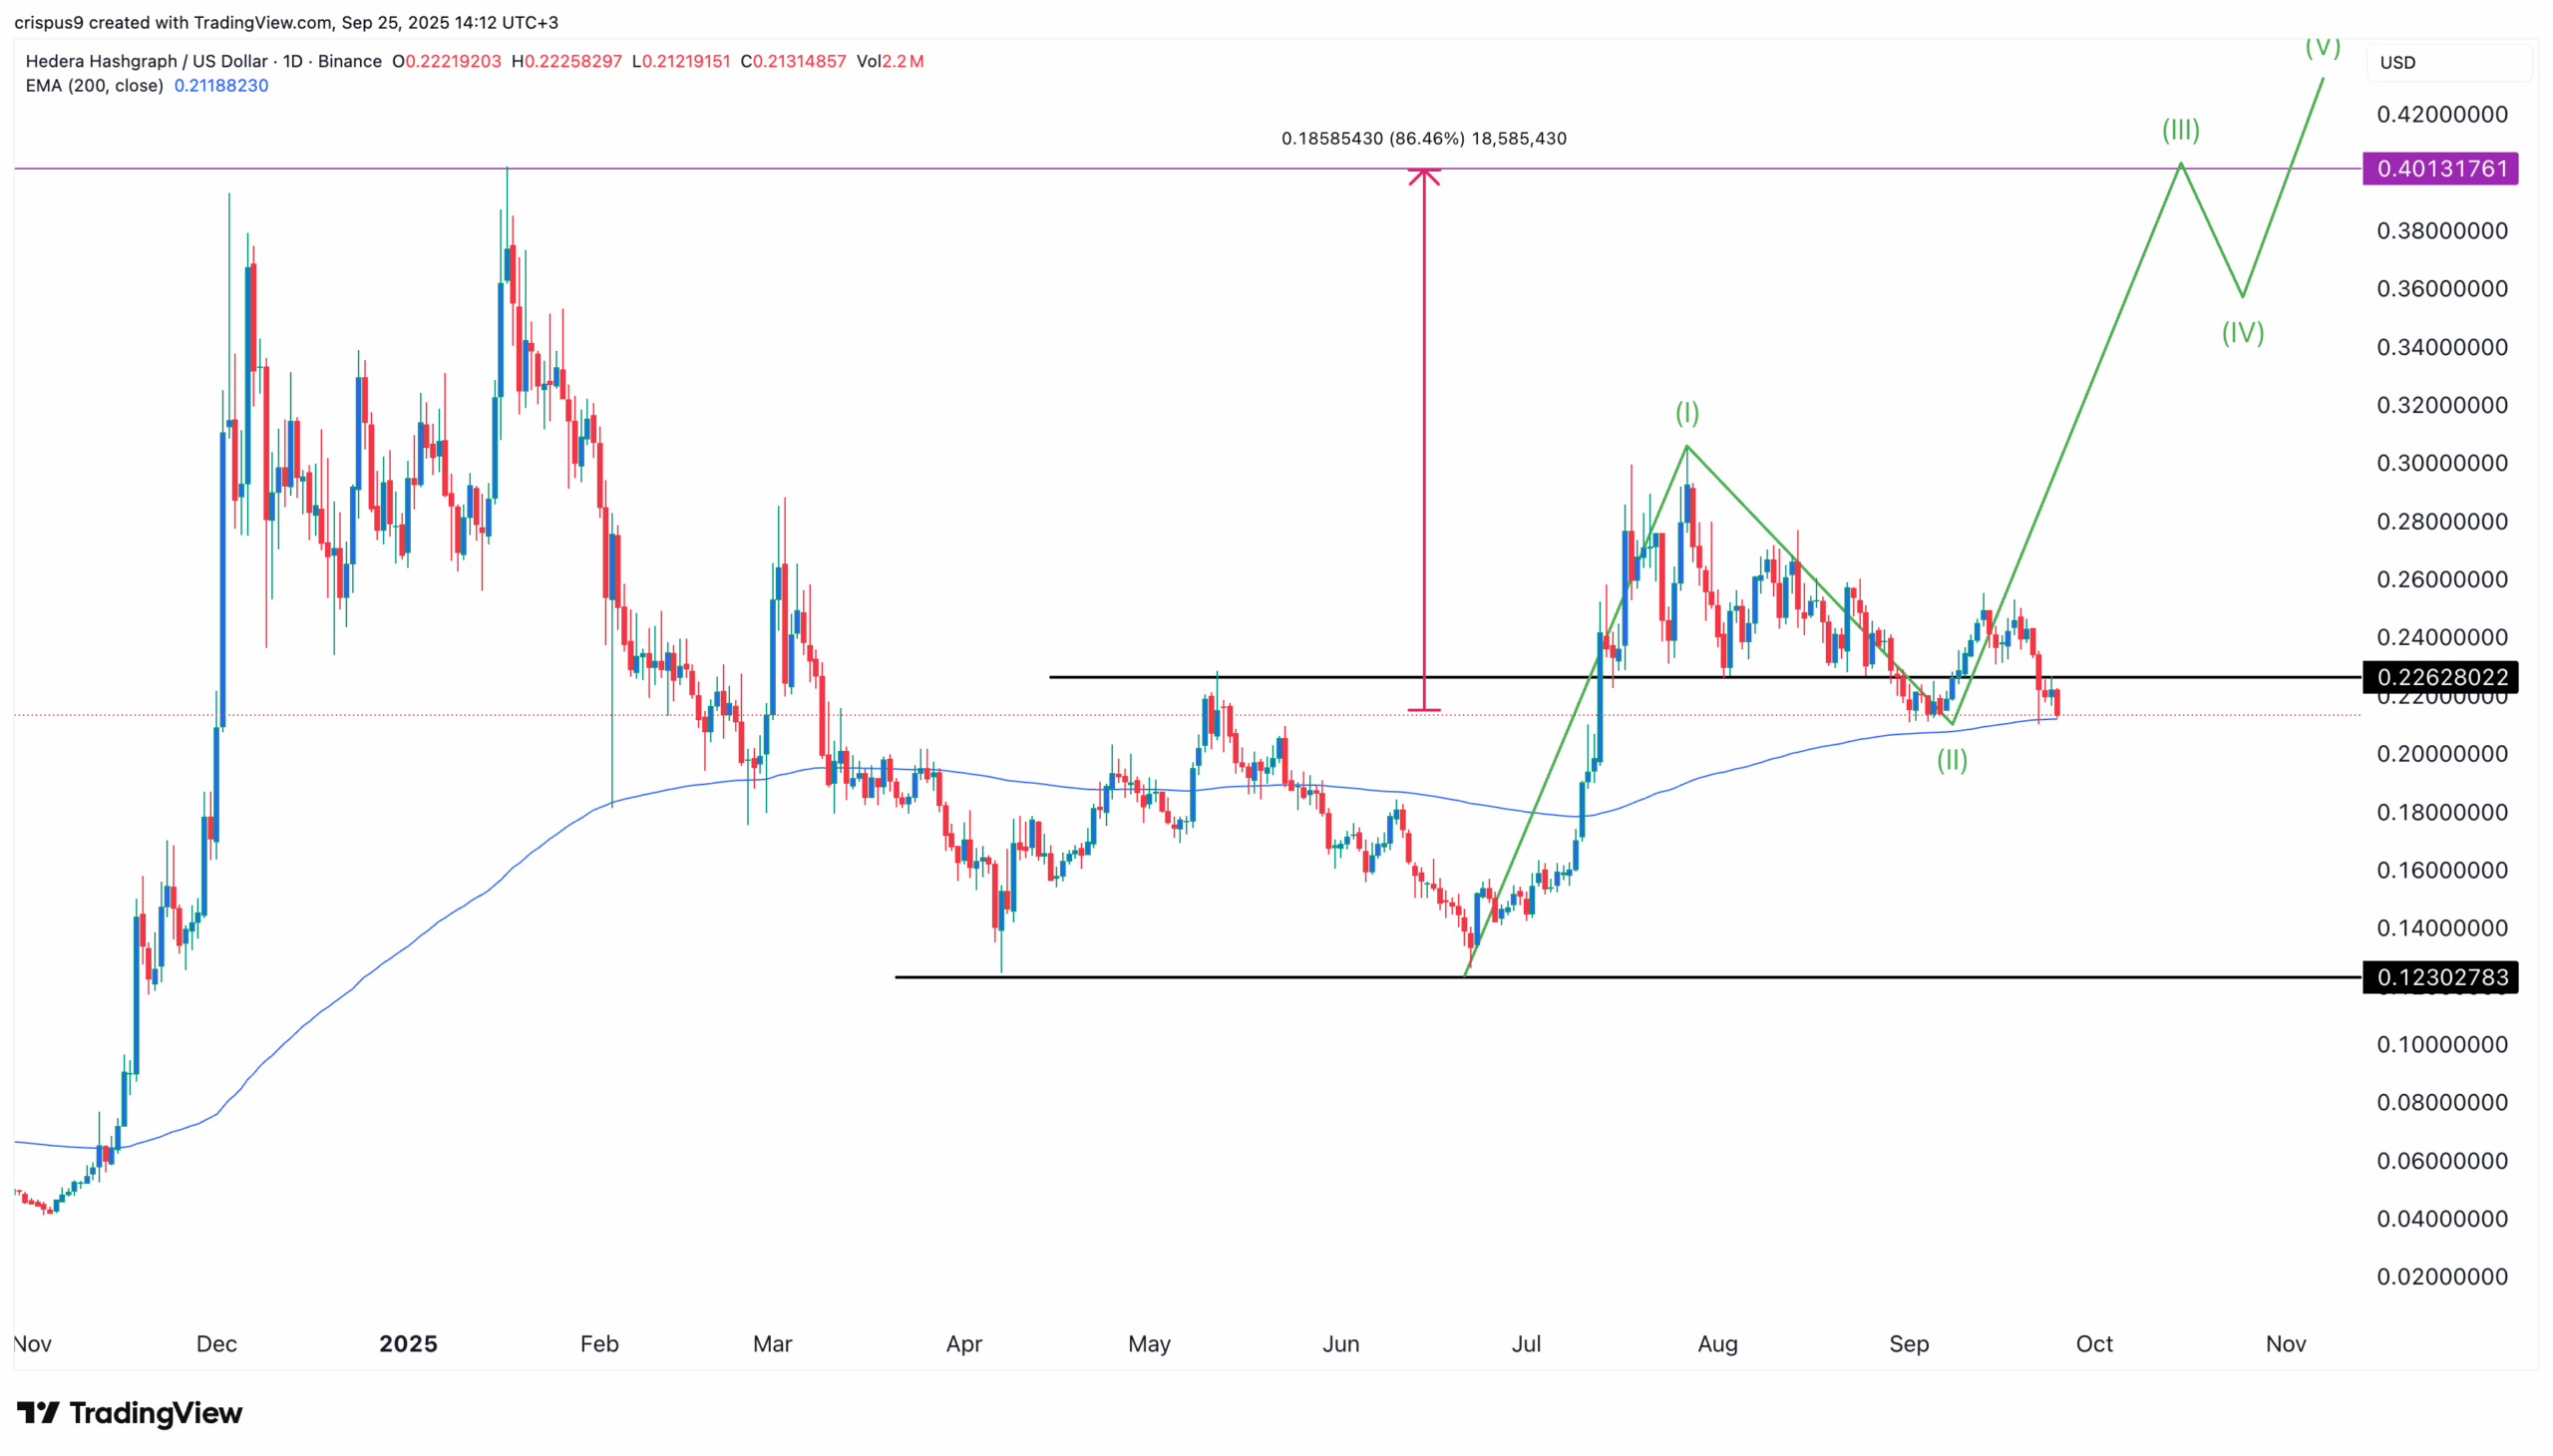

Hedera price chart | Source: TradingView
HBAR ETF Approval is the Main Catalyst, But Risks Remain
The main catalyst for the Hedera Hashgraph price is that the Securities and Exchange Commission (SEC) is considering whether to approve the Canary HBAR ETF. Just this week, the DTCC recognized the Hedera ETF filing. Such a move would lead to more inflows from American institutions and boost its price.
However, Hedera faces an ecosystem challenge despite its strong fundamentals and partnerships with companies like Google, Ubisoft, and IBM.
One challenge is that it has a minimal presence in the decentralized finance (DeFi) industry. Data compiled by DeFi Llama shows that the network has a total value locked (TVL) of $220 million. This is a small amount for an industry with over $250 billion in assets. Worse, the TVL has plunged from the year-to-date high of nearly $400 million.
A closer look at its DeFi ecosystem shows that it has not attracted big names like Uniswap and Aave. Instead, the biggest players in the network are Stader, SaucerSwap, and Bonzo Finance.
The other major ecosystem risk is that the volume in its decentralized exchanges (DEX) is negligible. Its DEX platforms handled just $8.74 million in volume in the last 24 hours.
Hedera, despite launching its Stablecoin Studio, has a minimal market share in the industry. Its stablecoin supply has plunged to just $86 million, meaning that it is not benefiting from the GENIUS Act in the United States.
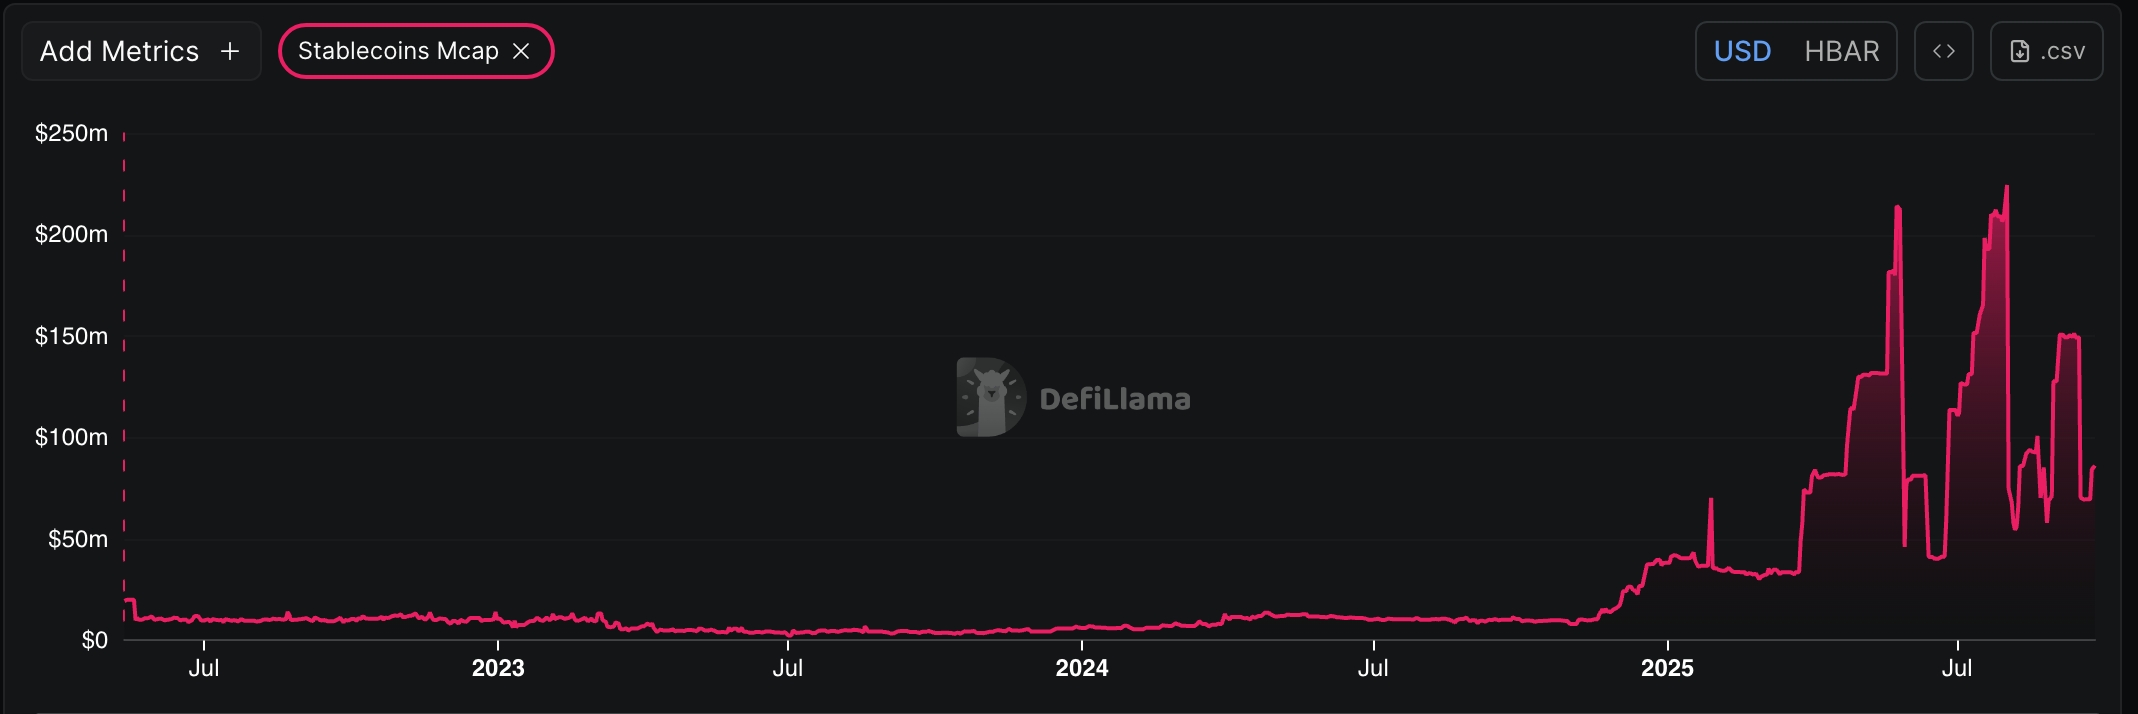

Hedera stablecoin supply | Source: DeFi Llama
The slow growth in its DeFi, DEX, and stablecoin industry explains why Hedera is not making money. DeFi Llama data reveals that Hedera had a fee of $2,109 in the last 24 hours. Its apps made just $21,259.
Source: https://coingape.com/markets/hbar-price-elliot-wave-signals-an-86-rebound-as-key-risks-remain/