Key Takeaways
Memecore surged to $2.55 before retracing, as spot buyers drove inflows while Futures traders leaned bearish with negative Funding Rates.
MemeCore [M] rallied 12.2% to a new all-time high of $2.55 before slightly retracing to $2.53 at press time.
Over the same period, its market cap jumped 12.12% to a new all-time high of $2.6 billion, reflecting massive capital inflow.
But what really triggered the recent uptick?
Retail buyers lead spot action
After sellers dominated the Spot market on the 13th of September, retail buyers jumped in and displaced them.
According to Coinalyze, MemeCore saw 82.45k in Buy Volume compared to 65.11k in Sell Volume. As a result, the token recorded a positive Buy Sell Delta of 17.3k, a clear sign of aggressive spot accumulation.


Source: Coinalyze
Exchange activity echoed this trend.
CoinGlass data showed Spot Netflow turned negative after spiking positive the prior day. Netflow dropped to -82k from +16k, suggesting higher outflows and accumulation.


Source: CoinGlass
That shift set up a bullish backdrop, as past spot dominance by buyers has often preceded rallies.
Futures market leans short
Surprisingly, while the Spot market turned to accumulation, the Futures market approached the market with caution.

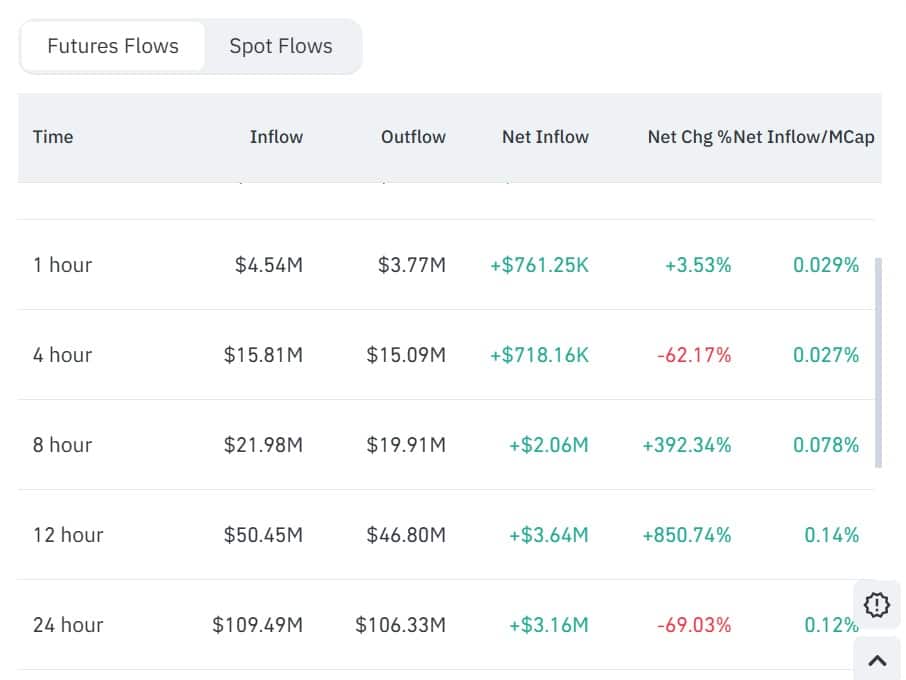
Source: CoinGlass
As per data, MemeCore recorded $109.49 million in inflows versus $106.33 million in outflows at press time, leaving Futures Netflow at $3.16 million. This marked a 69% decline over 24 hours.
Despite the rising capital inflow, the Funding Rates mainly remained negative.


Source: Coinalyze
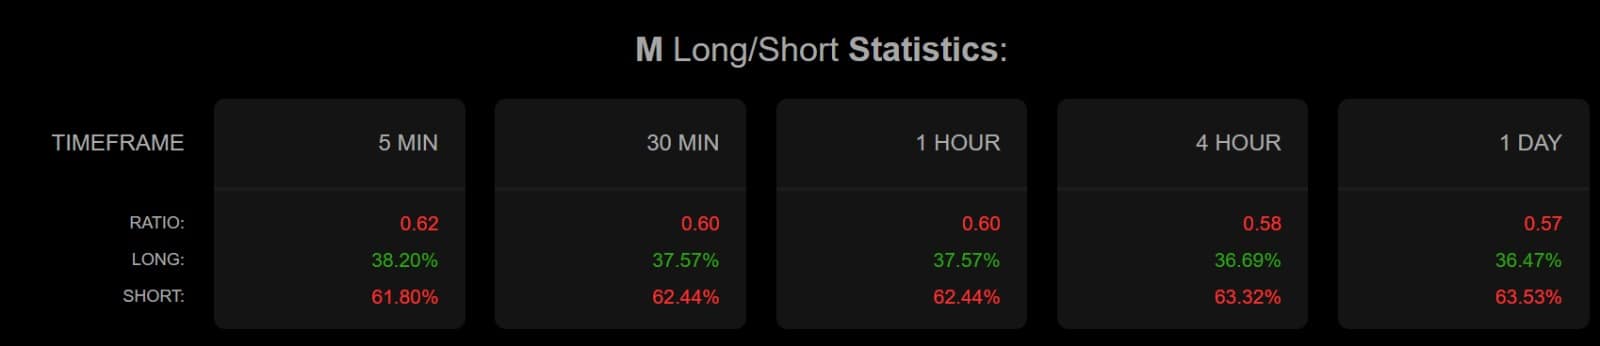
Coinalyze data showed MemeCore’s Funding Rate at -0.055 and Predicted Funding Rate at -0.0134. Rates have remained negative for two days, flipping positive only once in the past week.
Typically, when the Funding Rates are negative, it suggests that most market participants in Futures are bearish and taking short positions.

Source: Coinalyze
In fact, the Long/Short Ratio fell to 0.57, with shorts at 63.5% and longs at 36.5%. Such positioning reflected bearish conviction despite the spot rally.
Can bulls hold momentum?
AMBCrypto’s analysis found MemeCore rallied on speculative spot demand while bears leaned on futures, triggering a short squeeze.
At press time, TradingView data still showed a fragile uptrend. Stochastic RSI stayed below its signal at 60, while Relative Vigor Index sat at 0.34 under its signal line.

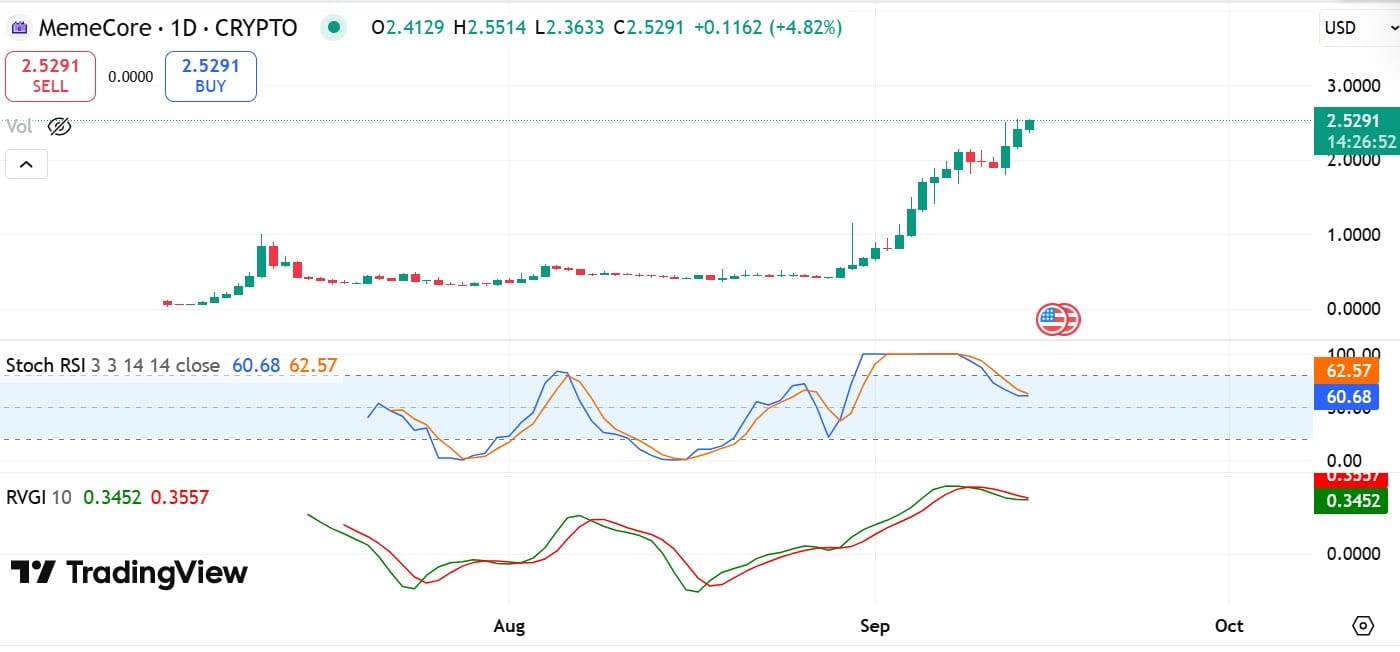
Source: TradingView
Typically, when these momentum indicators sit within a bearish zone, it suggests a weak trend and potential downside reversal.
Thus, if the prevailing market conditions persist, MemeCore could face a steep correction and drop to $2.1.
A bullish crossover on RVGI and Stochastic RSI would be needed to keep the uptrend alive and open room for another all-time high.
Source: https://ambcrypto.com/memecore-rallies-12-to-new-ath-still-caution-remains/