- US-EU trade deal boosts USD, affecting global markets and gold.
- USD strength leads to euro and yen declines.
- Safe-haven demand causes gold price surge.
An unexpected trade agreement between the US and EU, announced at Turnberry on July 27, 2025, has boosted global market optimism and led to a surge in US dollar assets.

This agreement offers a framework for transatlantic commerce stability, impacting currency and commodity markets, and influencing potential Federal Reserve rate decisions.
US-EU $600 Billion Investment Alters Market Dynamics
A US-EU trade agreement, signed by President Donald Trump and Ursula von der Leyen, introduced lower tariffs, aimed at promoting predictability in transatlantic commerce. In consequence, the US dollar gained strength as investors rotated assets. This shift resulted in meaningful declines for both the euro and yen, demonstrating a clear preference for USD amid the adjusted trade terms.
The trade deal has spurred immediate financial flow adjustments. The agreement includes the EU committing to a USD 600 billion investment in the US and significant purchases of US energy exports. Additionally, US tariffs on EU goods were confronted with a provisional framework to maintain stability.
“The deal is a foundation of predictability for transatlantic commerce.” – Ursula von der Leyen, President, European Commission
Regulatory Implications and Bitcoin Market Analysis
Did you know? The US-EU trade agreement, which decreases tariffs less than expected, mirrors previous initiatives that aimed to stabilize transatlantic economic relations, preventing earlier escalation scenarios of up to 30% tariffs.
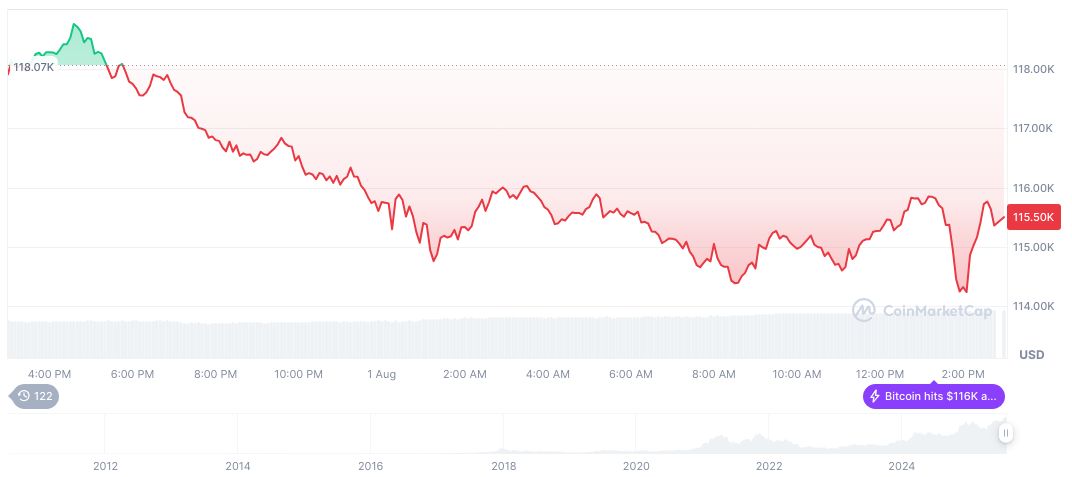
According to CoinMarketCap, Bitcoin (BTC) is currently valued at $113,650.30, holding a market cap of $2.26 trillion and capturing 61.38% of market dominance. Notably, BTC experienced a 1.15% decline over the past 24 hours, amidst varied price changes over recent months, with trading volumes reaching $72.89 billion.
Insights from Coincu research indicate potential regulatory adjustments may explore the technological implications stemming from such major economic policies. Historical precedence shows trade agreements occasionally shift global financial strategies, heightening the necessity for careful economic approach review.
| DISCLAIMER: The information on this website is provided as general market commentary and does not constitute investment advice. We encourage you to do your own research before investing. |
Source: https://coincu.com/markets/us-eu-trade-deal-impact/
