After testing a weekly high near $2,523, the Ethereum price today is trading around $2,448, caught in a tight zone of indecision just beneath multiple resistance bands. While ETH rebounded from June’s lows near $2,100, it now faces a critical technical inflection as the broader structure narrows into a multi-month symmetrical triangle.
What’s Happening With Ethereum’s Price?
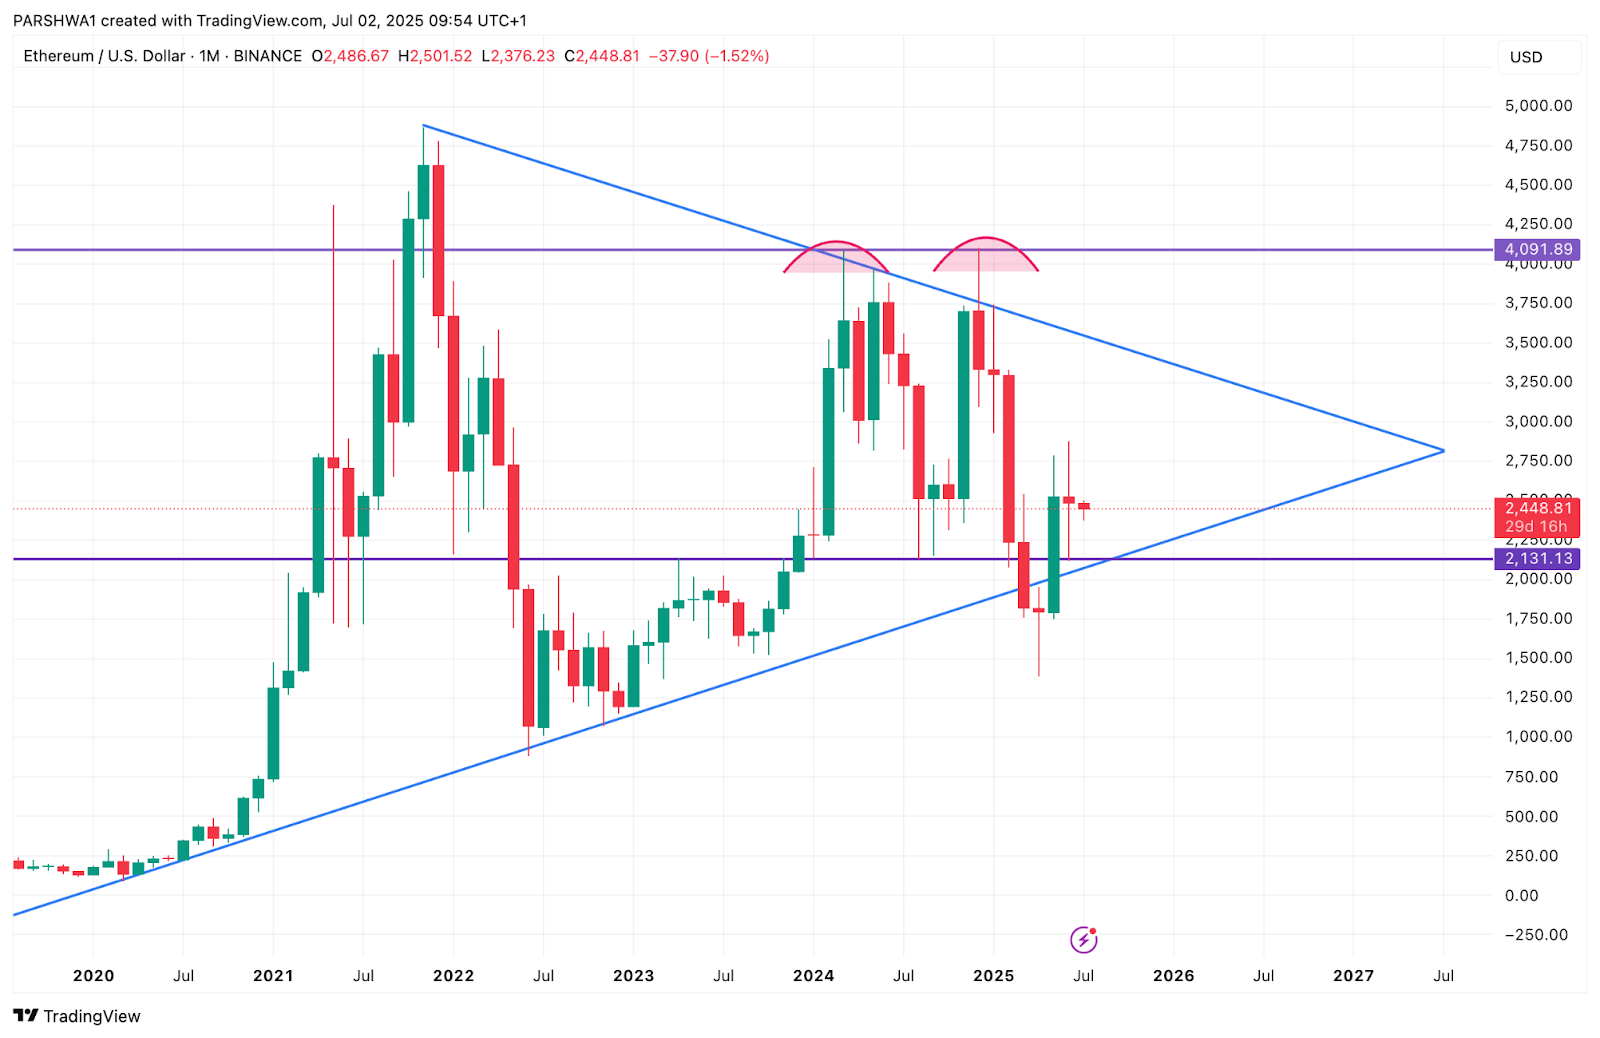

On the monthly chart, ETH remains wedged between long-term uptrend support from the March 2020 bottom and descending resistance from its $4,900 peak. The price structure continues to compress, and the recent double-top rejection below $4,100 signals lingering macro selling pressure. Despite this, the ascending base near $2,130 has held for the third time since mid-2023, forming a strong foundation.
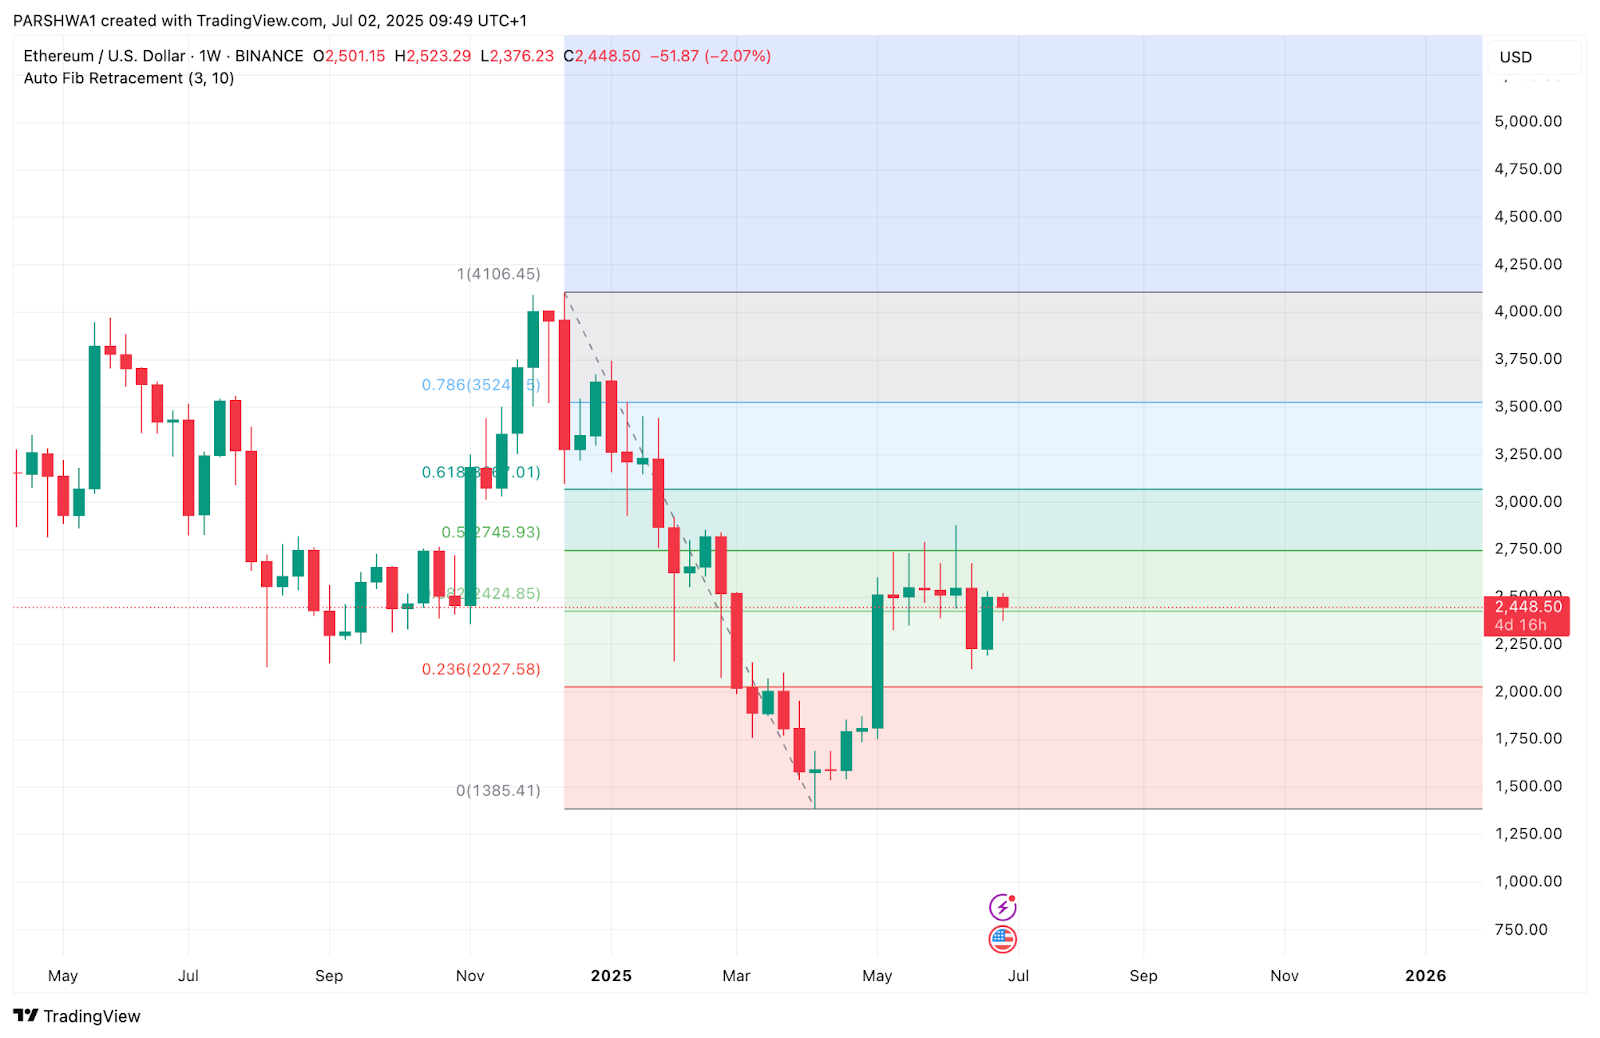
The weekly chart shows Ethereum capped below the $2,745 level (Fib 0.5) while holding just above $2,424 (Fib 0.382). This zone remains pivotal. ETH is trading inside a tightening structure, with lower highs indicating reduced bullish momentum. The Bollinger Bands are flattening on higher timeframes, a typical precursor to volatility expansion.
Why Is The Ethereum Price Going Down Today?
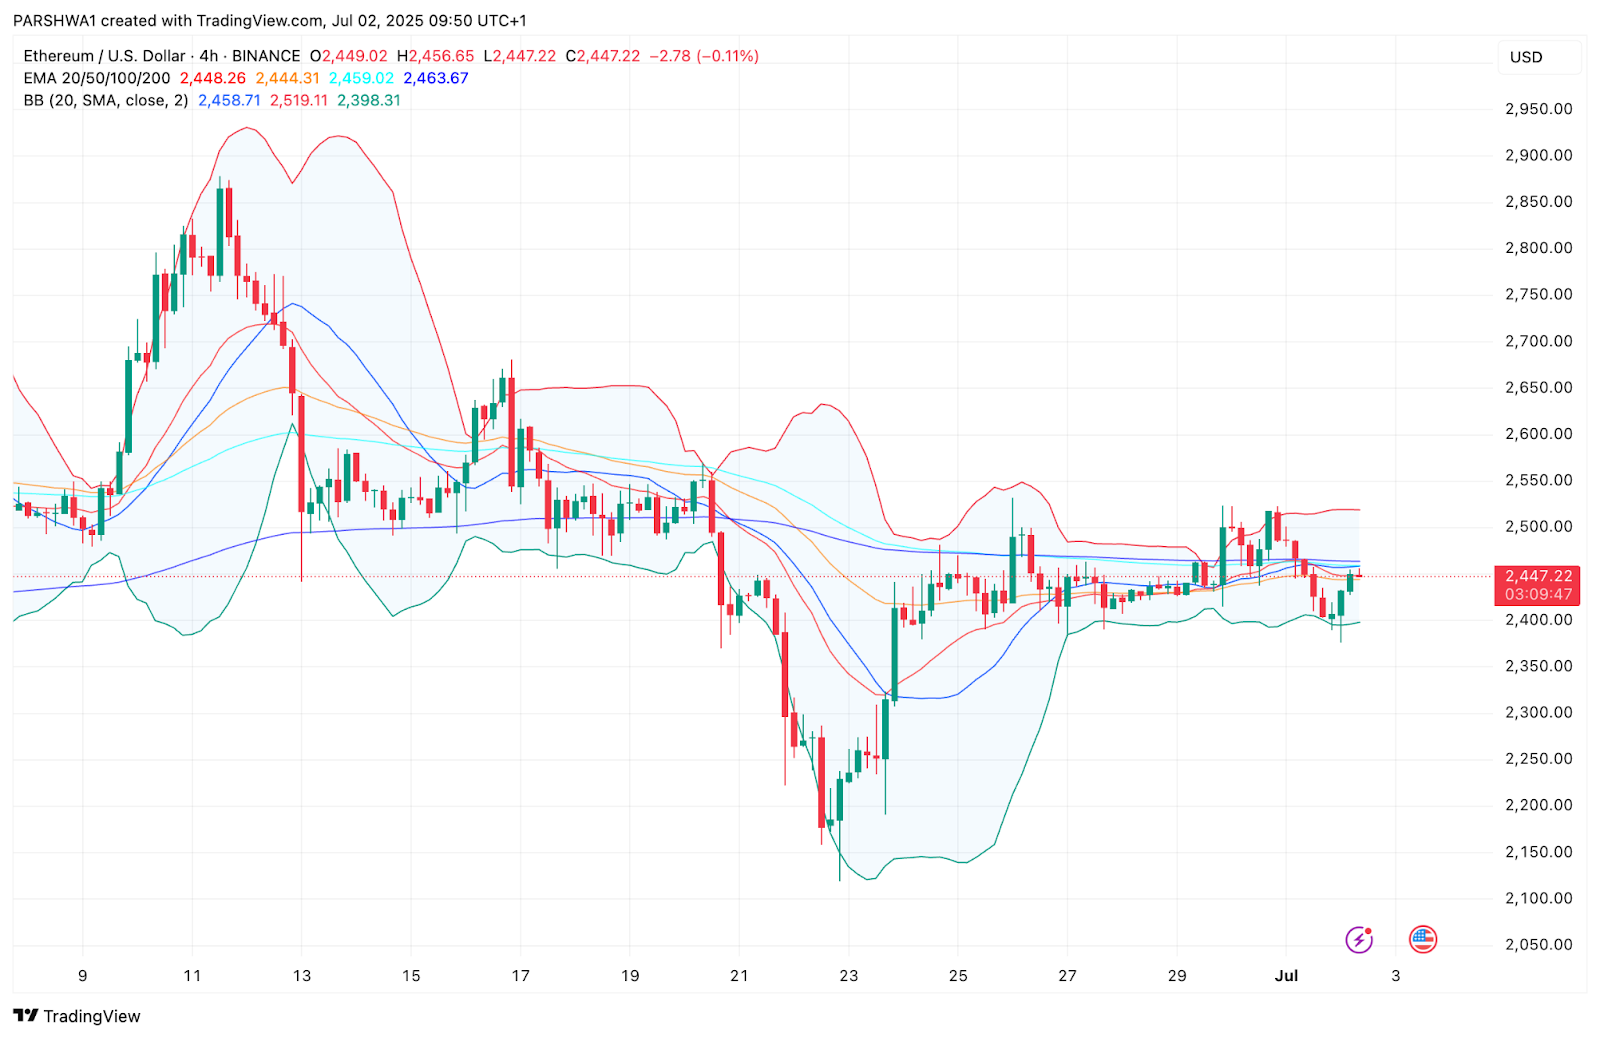
The recent ETH retracement appears tied to declining volume and fading intraday momentum, especially as the price stalls near the $2,450–$2,470 resistance zone. On the 4-hour chart, Ethereum rejected the mid-Bollinger Band and EMA cluster (20/50/100/200), all converging between $2,444 and $2,463. This dynamic resistance has proven stubborn, and multiple failed attempts to break above this area signal exhaustion.
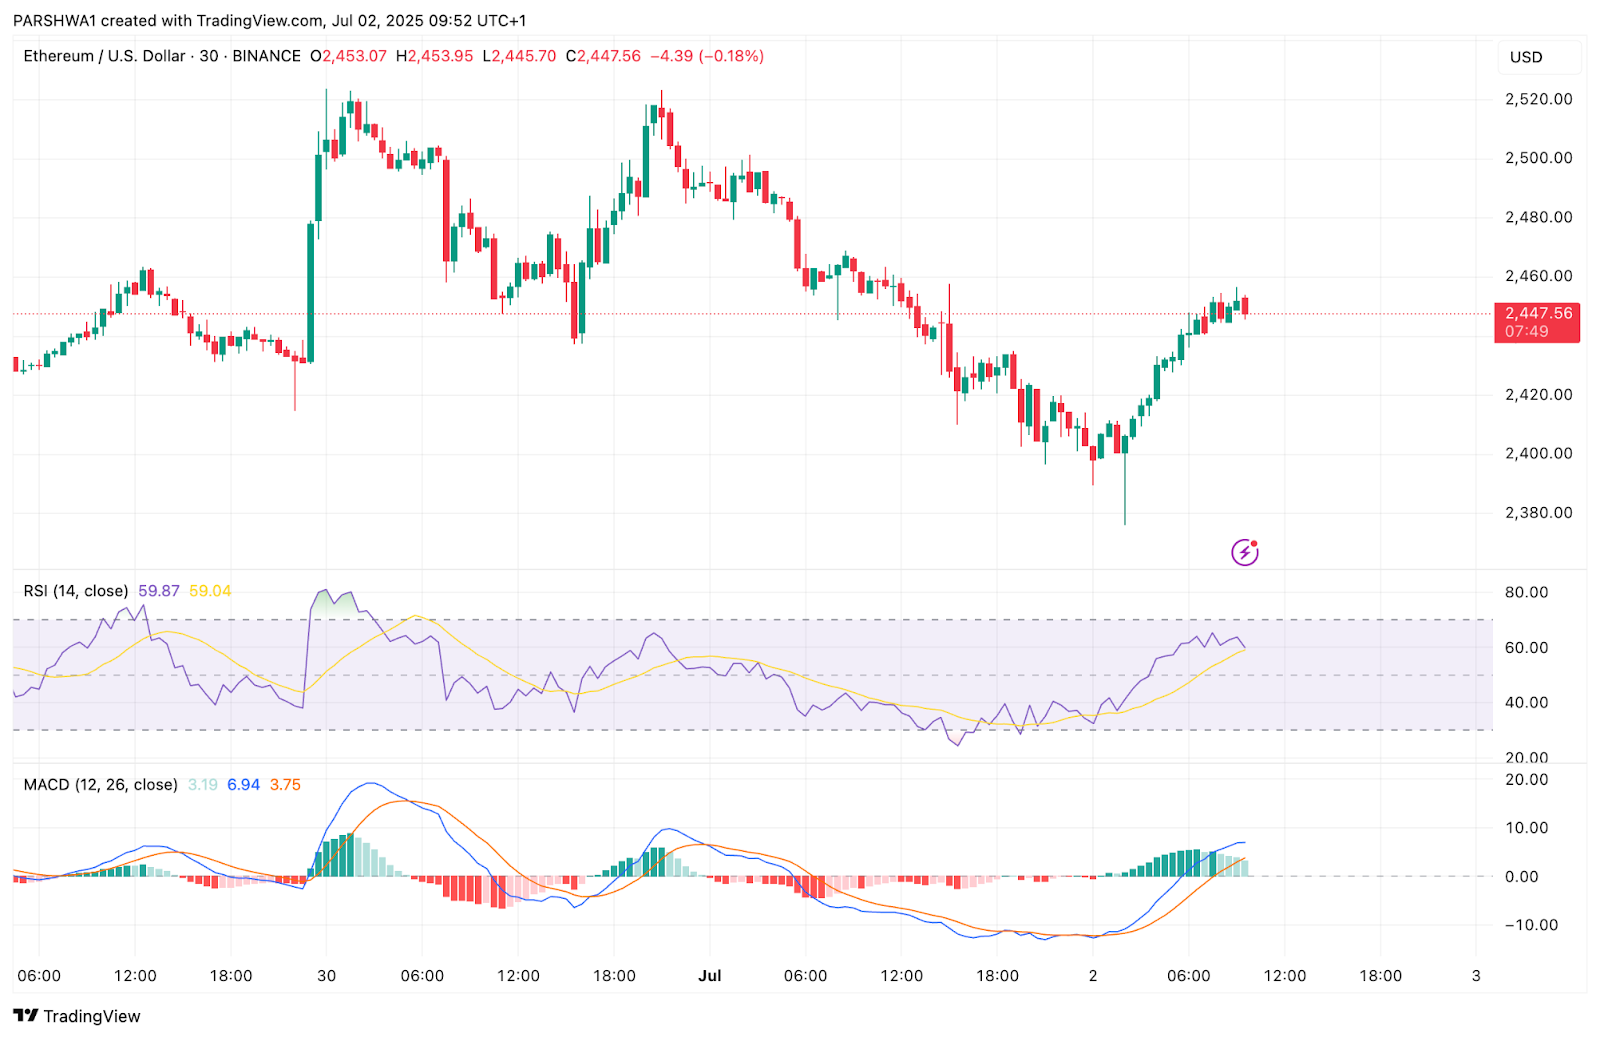
The 30-minute MACD shows the bullish crossover is weakening, while the RSI has slipped slightly from overbought conditions, now at 59.04. While this still reflects mild bullish strength, the fading slope hints at cooling upward pressure. Parabolic SAR dots remain below price, supporting the current bounce — but the lack of sustained volume limits breakout confirmation.
Additionally, the On-Balance Volume (OBV) indicator continues to trend flat, showing no meaningful accumulation yet, which aligns with the ranging structure.
ETH Price: Squeeze Builds as ETH Traps Between Support and Resistance
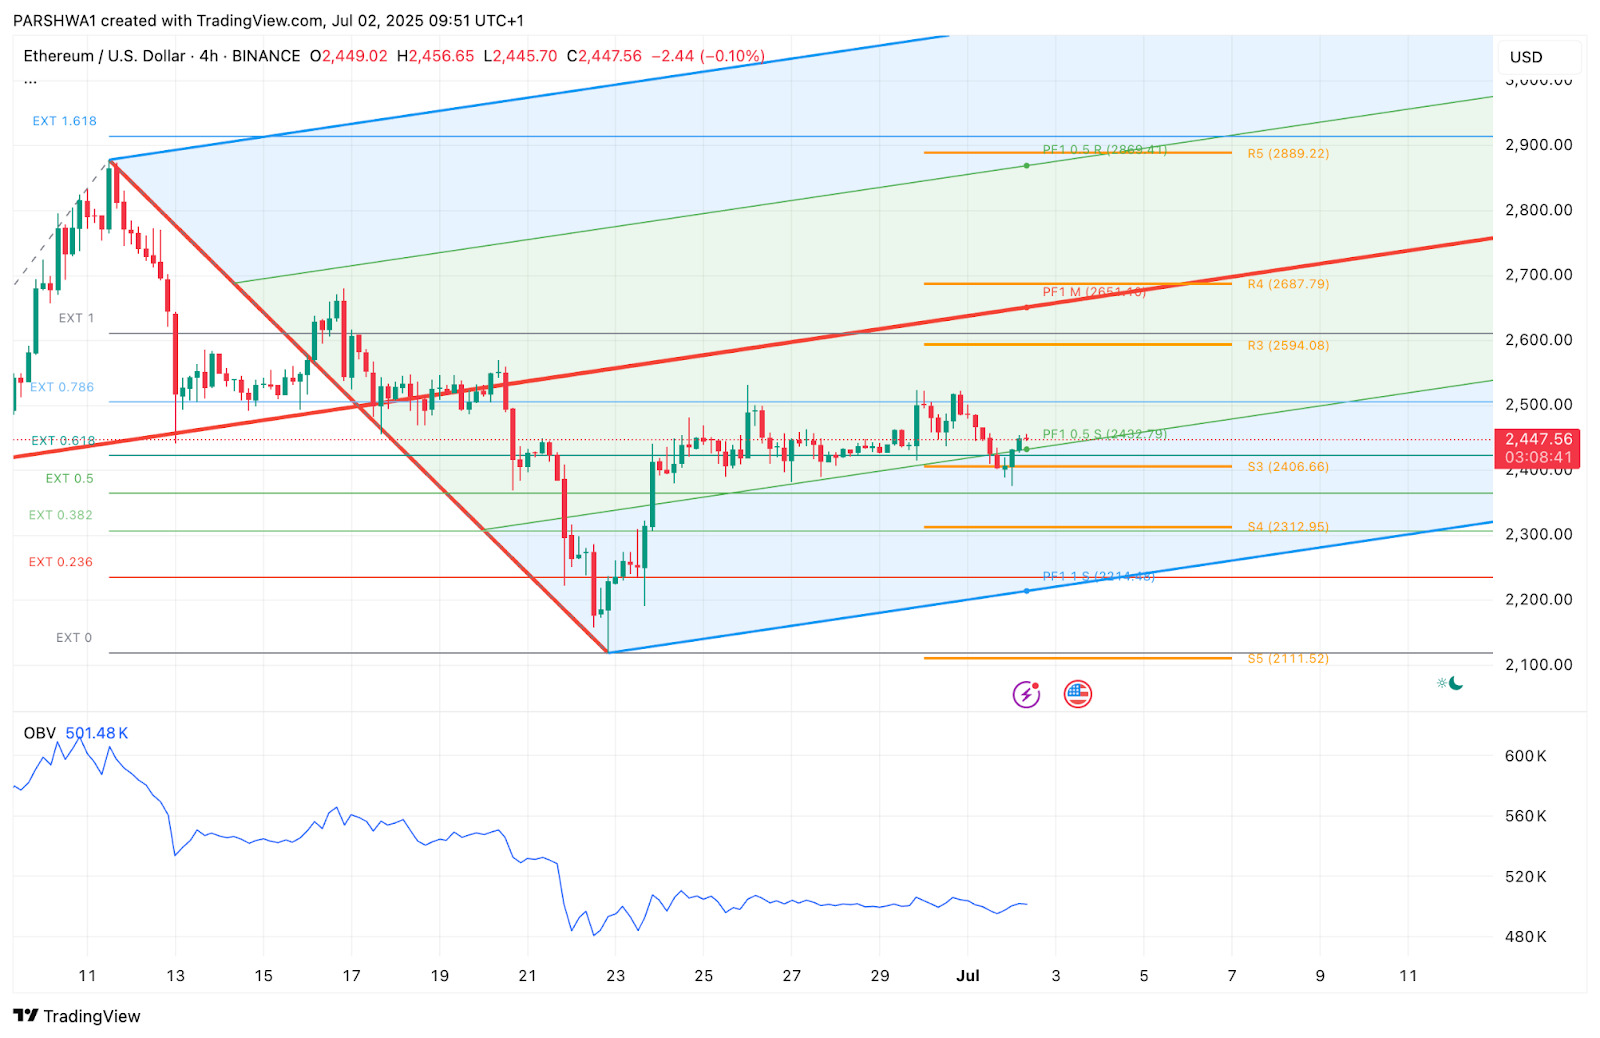
On the 4H chart, Ethereum is trading within a modified pitchfork channel, bouncing off support near $2,406 and attempting to reclaim the $2,475 handle. The Fib extension grid shows resistance at $2,594 (R3) and $2,687 (R4), while downside pivots sit at $2,312 and $2,211. The price is moving sideways between these levels, indicating a coiling setup.
The latest bullish candle is hovering right above the 0.5 retracement line from the most recent swing move, which may act as a launchpad if bulls reclaim momentum.
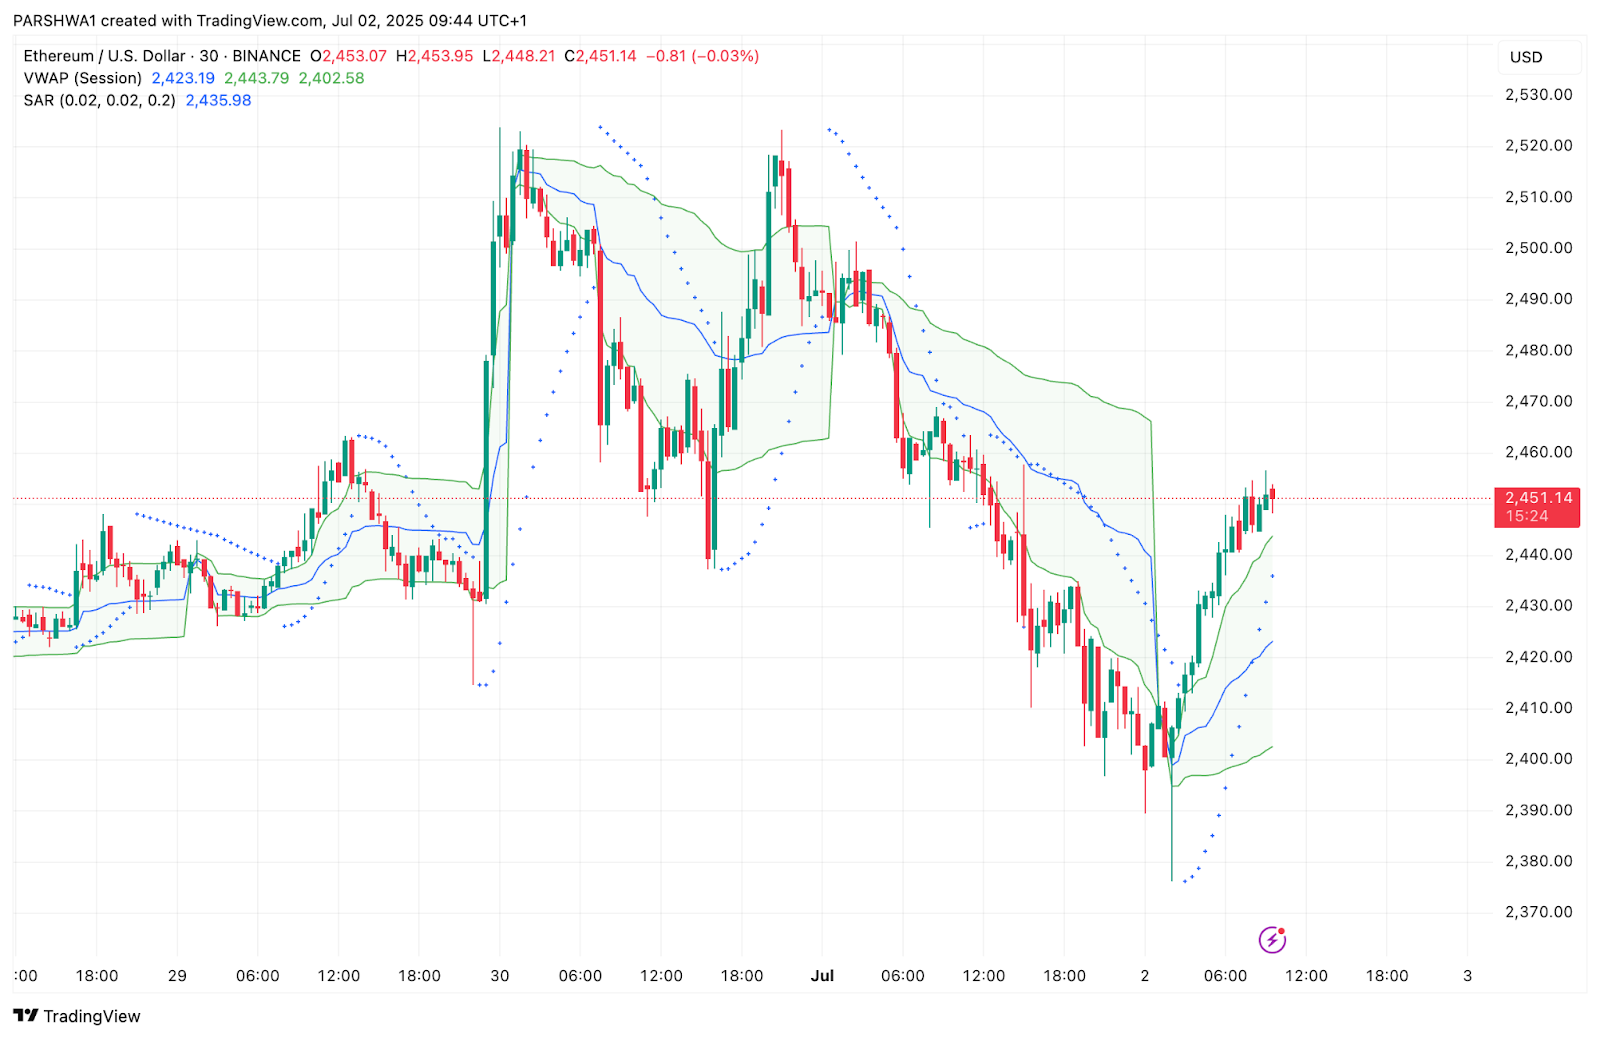
Ichimoku Cloud and VWAP zones (on the 30-min view) also show consolidation below the daily VWAP of $2,443 and the SAR support at $2,435. This confluence could allow a breakout toward $2,500 if volume confirms, but a failure to hold $2,435 may reintroduce bearish pressure.
ETH Price Prediction: Short-Term Outlook (24H)
In the short term, the Ethereum price action suggests a squeeze setup within a broader neutral-to-bullish flag. A successful close above $2,470 would target the $2,520–$2,545 zone, followed by a potential breakout toward $2,594 and $2,687, where the pitchfork R3/R4 lines intersect with historical supply.
Conversely, a breakdown below $2,424 would open up risk toward $2,312 (support pivot) and $2,211, with the key macro base still sitting at $2,131. The bias remains cautiously bullish as long as ETH holds above $2,424, but without strong volume, bulls may struggle to sustain upside momentum.
Ethereum Price Forecast Table: July 3, 2025
| Indicator/Zone | Level (USD) | Signal/Notes |
| Ethereum price today | $2,448 | Consolidating near key resistance |
| Resistance 1 | $2,470 | EMA/Bollinger convergence |
| Resistance 2 | $2,594 | Pitchfork R3, Fib extension zone |
| Support 1 | $2,424 | Weekly Fib 0.382, key bull line |
| Support 2 | $2,312 | Pitchfork S4, secondary support |
| MACD (30-min) | Fading Bull | Momentum flattening |
| RSI (30-min) | 59.04 | Cooling from overbought |
| Bollinger Bands (4H) | Tightening | Volatility likely to expand |
| OBV | Sideways | Lack of strong accumulation |
| Trend Bias (24H) | Neutral-Bull | Breakout likely if $2,470 flips clean |
Disclaimer: The information presented in this article is for informational and educational purposes only. The article does not constitute financial advice or advice of any kind. Coin Edition is not responsible for any losses incurred as a result of the utilization of content, products, or services mentioned. Readers are advised to exercise caution before taking any action related to the company.
Source: https://coinedition.com/ethereum-eth-price-prediction-for-july-3-2025/