After multiple failed attempts to break above $2.35 in June, the XRP price today is trading around $2.189, caught within a tight consolidation channel just below the $2.20 zone. Despite low volatility, intraday indicators suggest bulls are gradually regaining strength after defending the critical $2.10 support level.
What’s Happening With XRP’s Price?
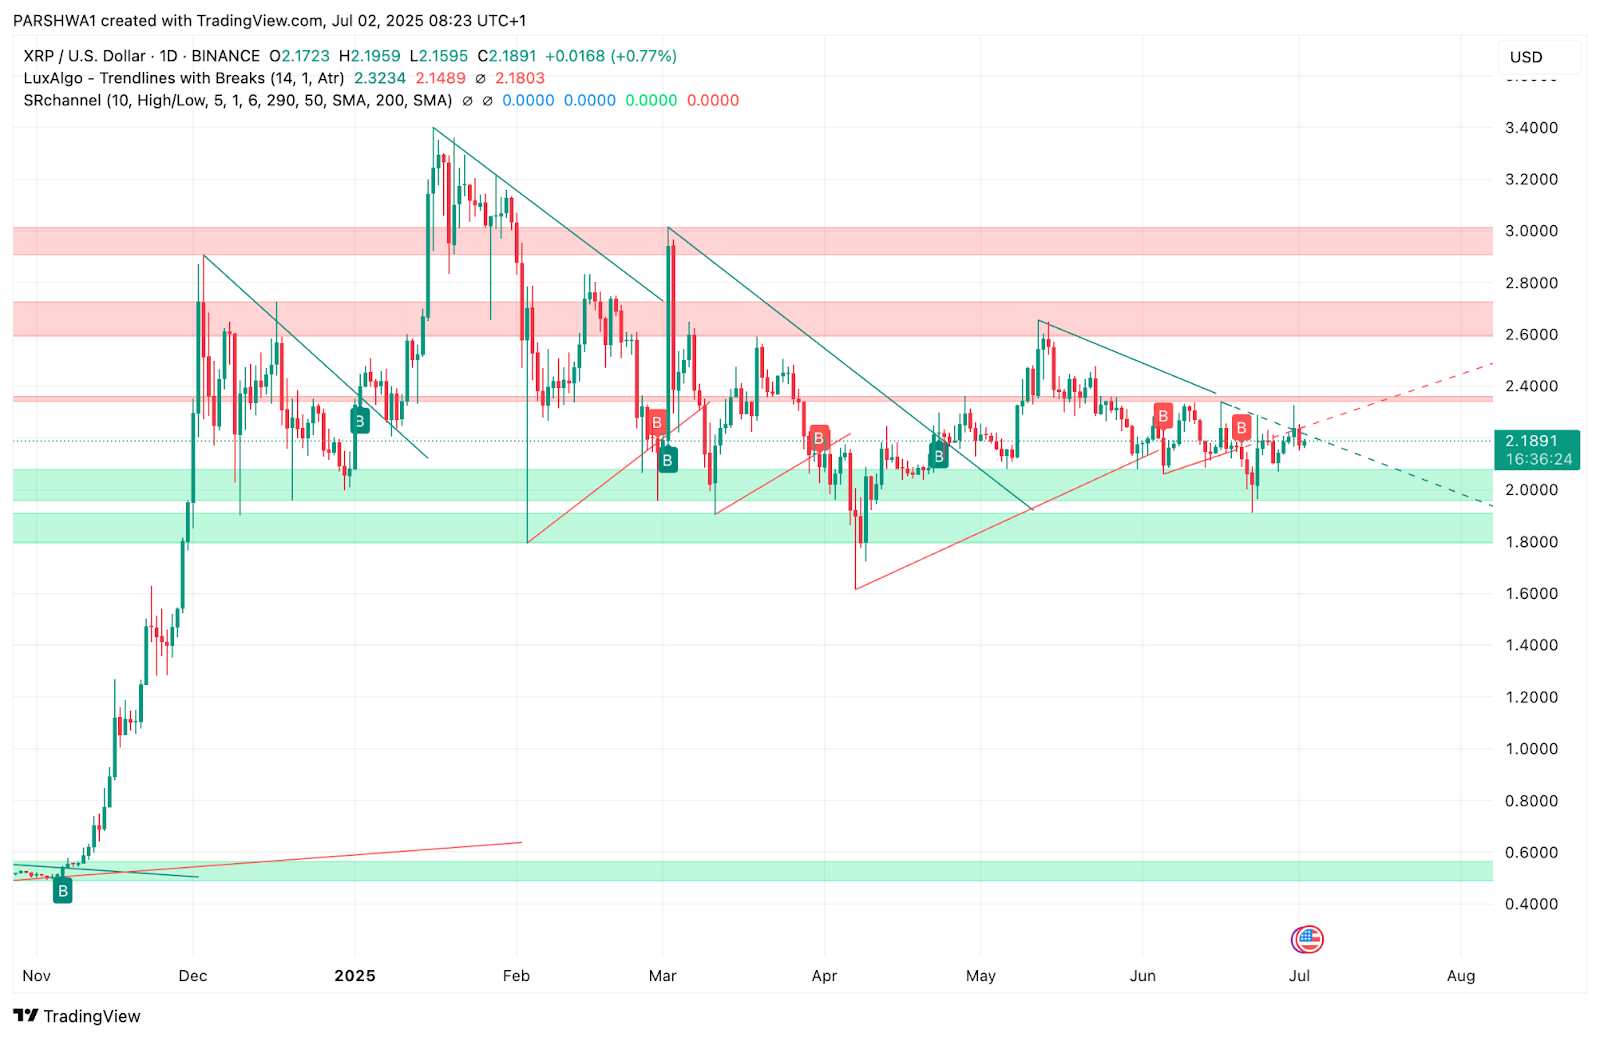

Recent price action shows XRP price forming a contracting triangle structure between descending resistance near $2.25 and rising trendline support from the $2.03 pivot low. The daily chart also shows the price wedging into the apex of this structure, increasing the likelihood of a breakout.
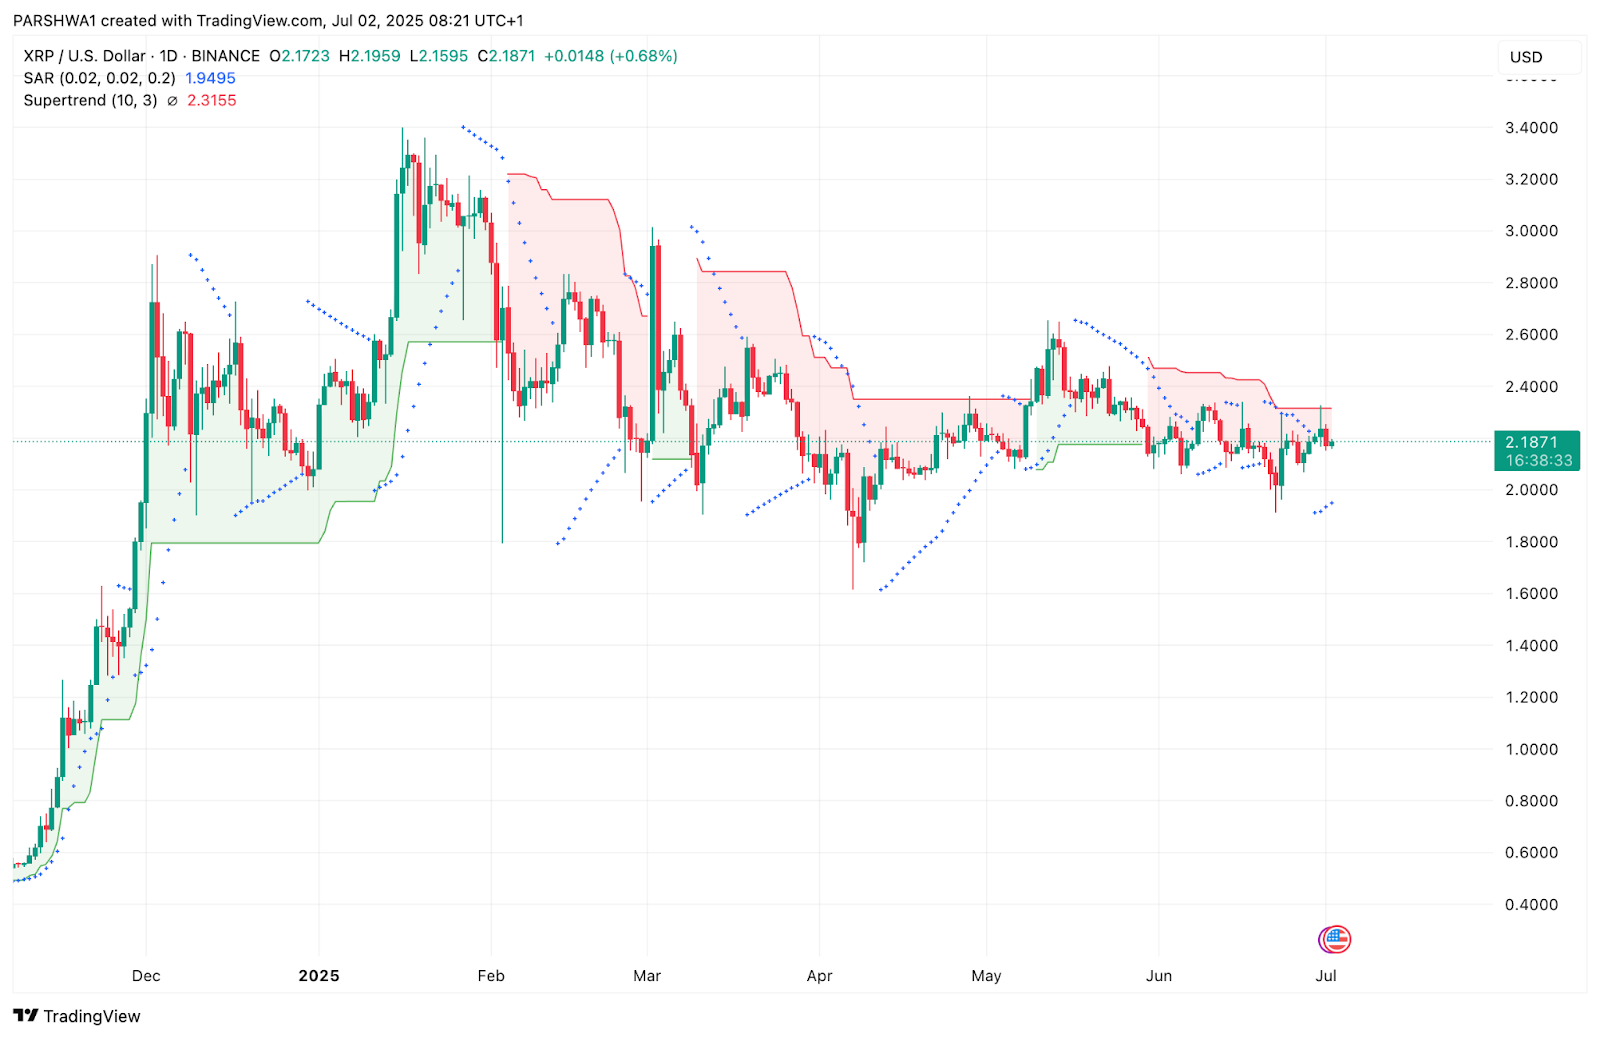
According to the Supertrend indicator, XRP remains under a red sell band with the trend flip zone near $2.31, making it a key upside hurdle. The Parabolic SAR, however, has flipped below price on the daily chart, suggesting short-term bullish pressure is building.
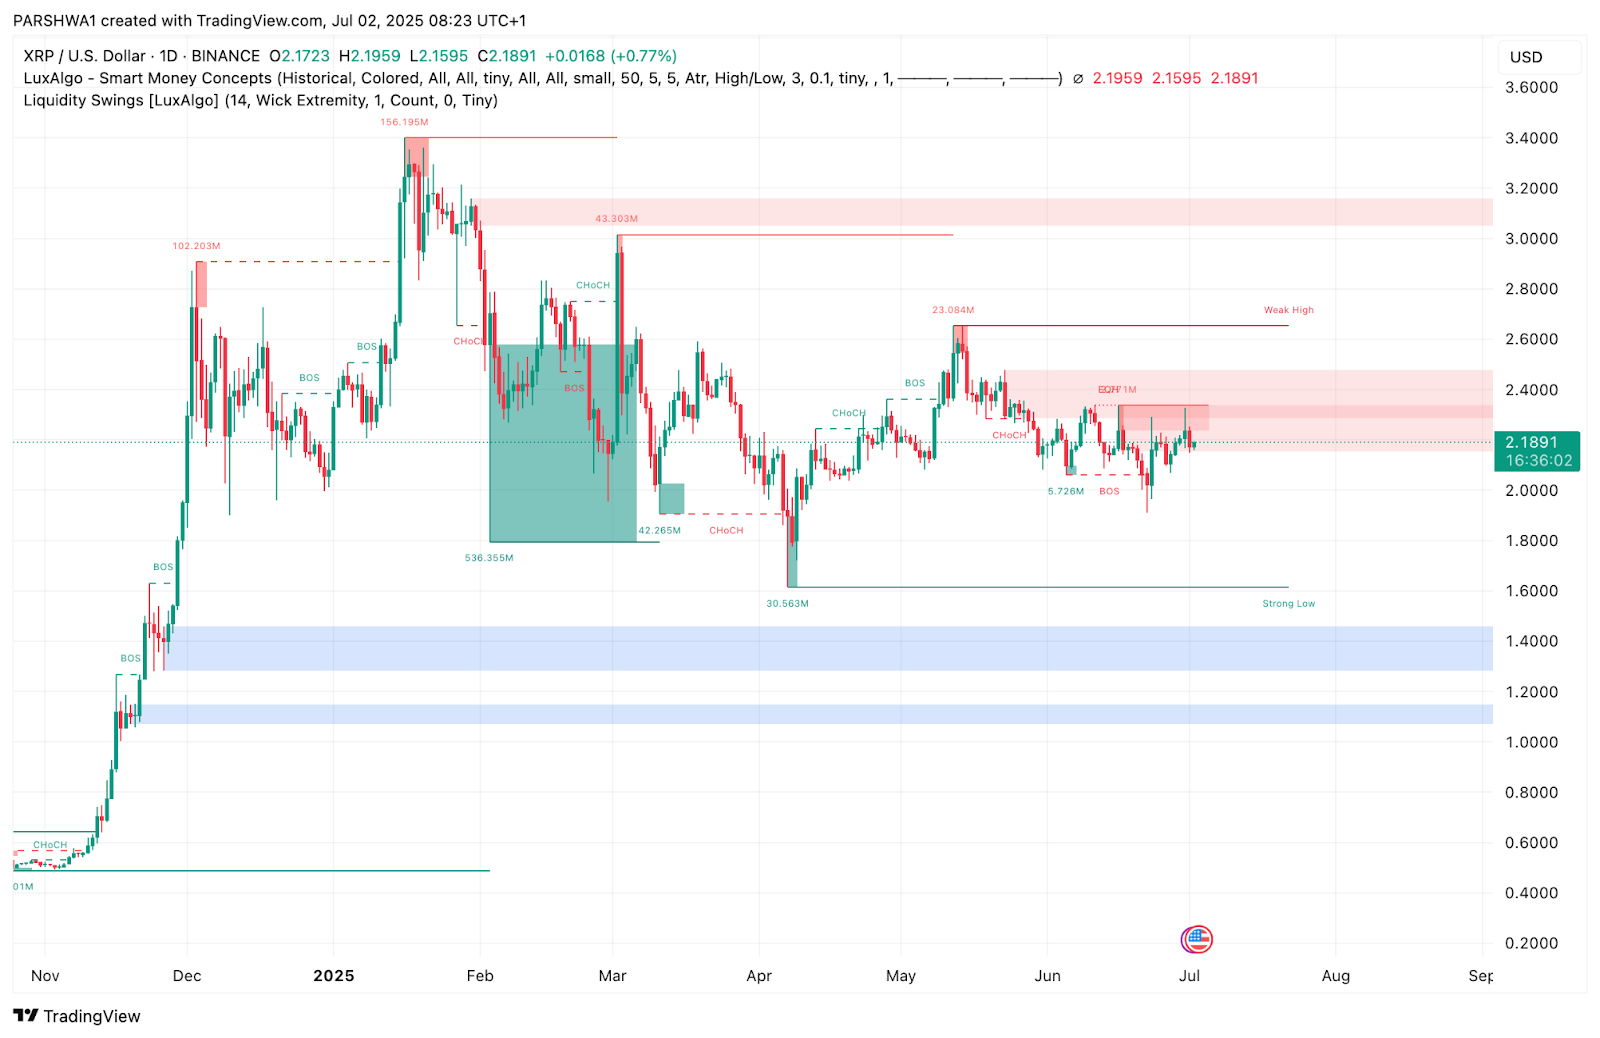
Smart Money Concepts (SMC) highlights multiple CHoCH and BOS levels between $2.05 and $2.25. Notably, XRP reclaimed minor BOS zones around $2.16–$2.18, and current liquidity rests just above the $2.24 level. Unless price invalidates this structure, upside continuation remains a probable scenario.
Why Is the XRP Price Going Up Today?
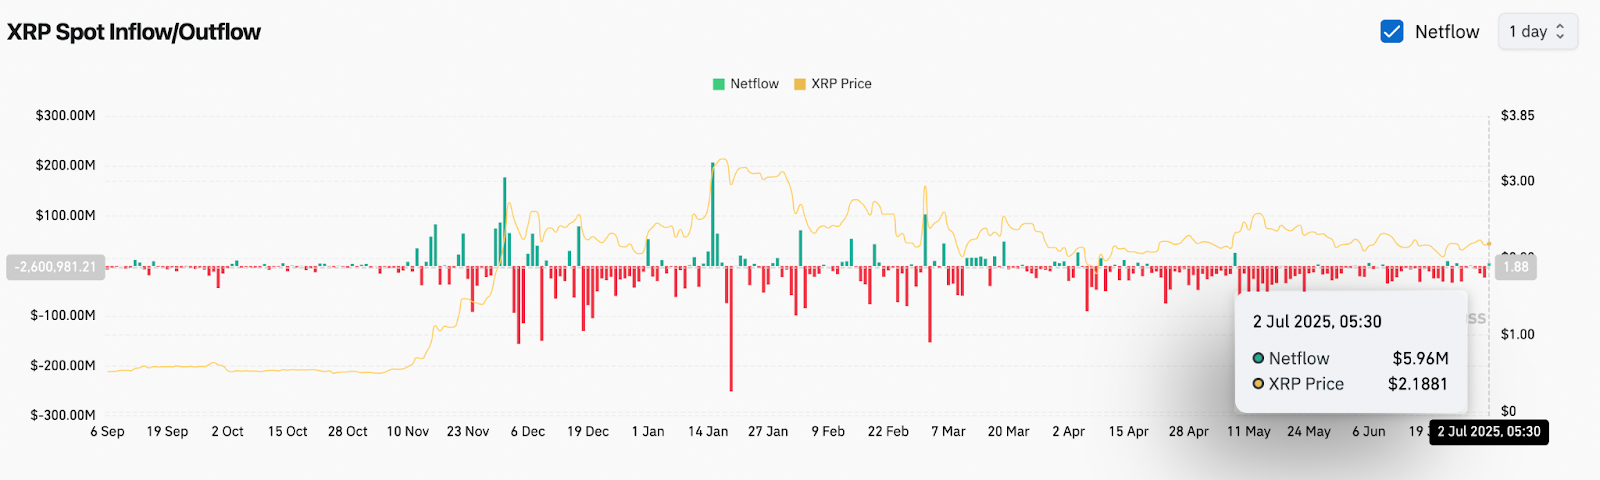
The bounce from $2.15 on July 1 coincided with renewed capital inflow into spot markets. According to the latest data, XRP net inflow hit $5.96M on July 2, marking a rare bullish signal after persistent net outflows in June. This uptick in demand supports the rebound from support zones.
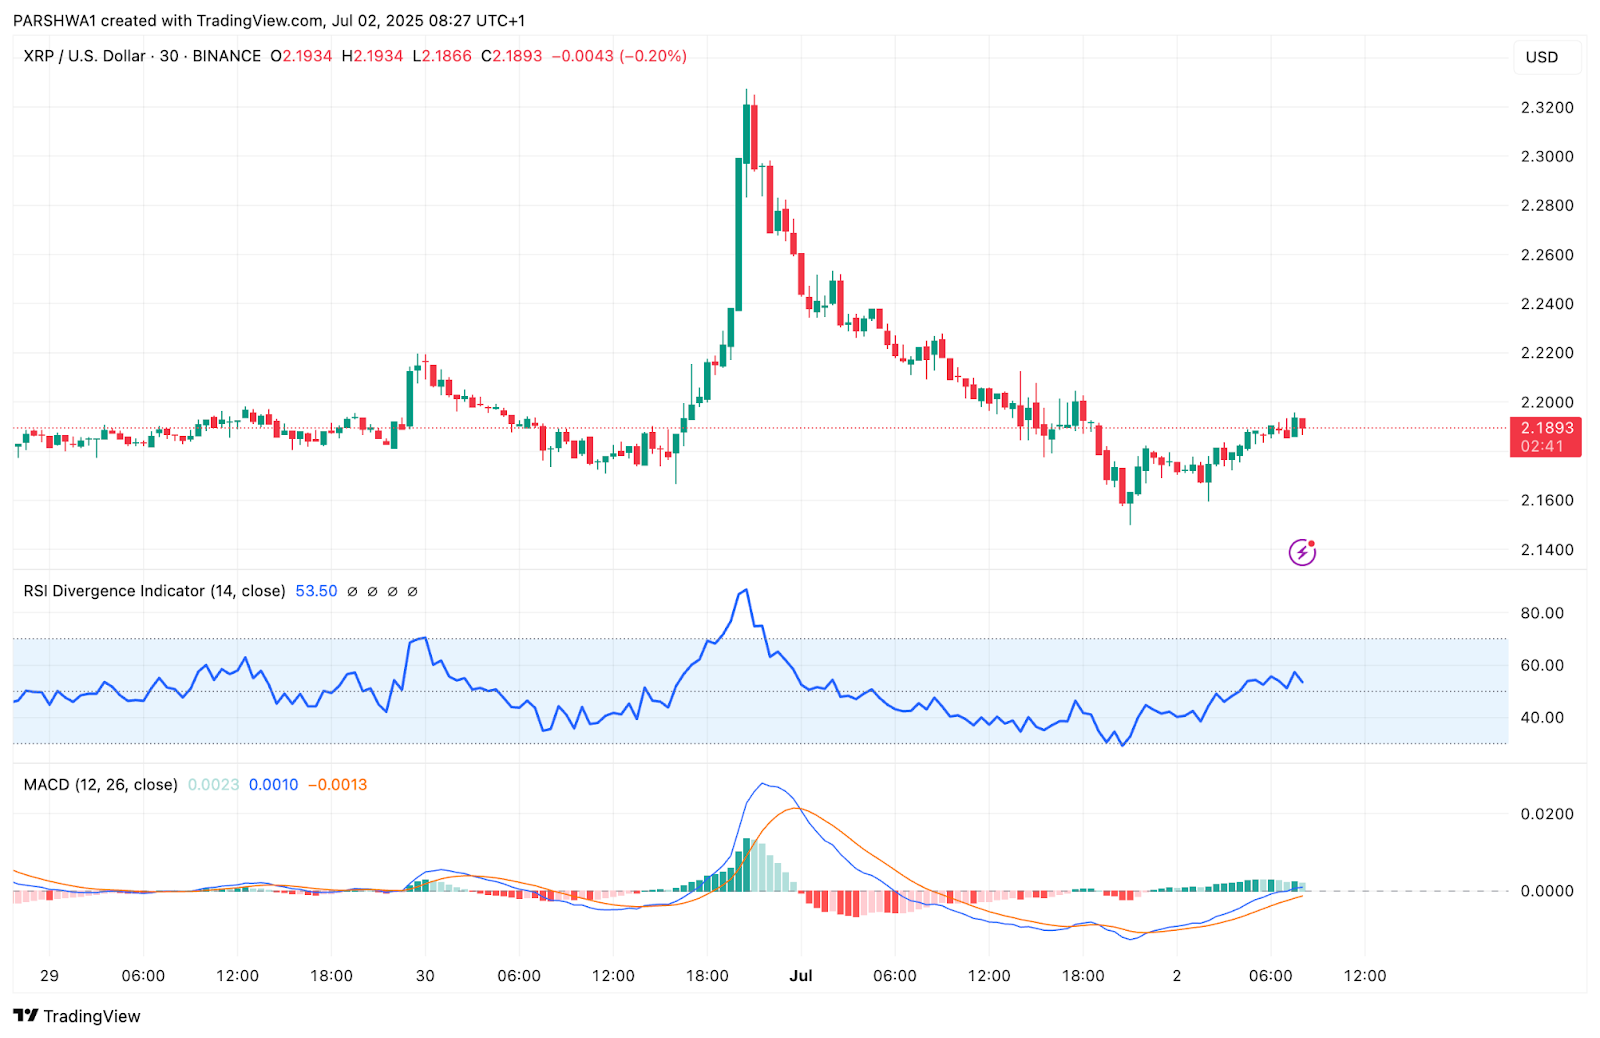
On the 30-minute chart, the RSI divergence indicator shows a higher low while price made a lower low—often a precursor to reversal. RSI currently sits at 53.5, suggesting neutral-to-bullish momentum. Additionally, the MACD histogram has flipped green with a crossover forming below the zero line, indicating early-stage trend reversal potential.
XRP Price Indicators, Signals and Charts (24h)
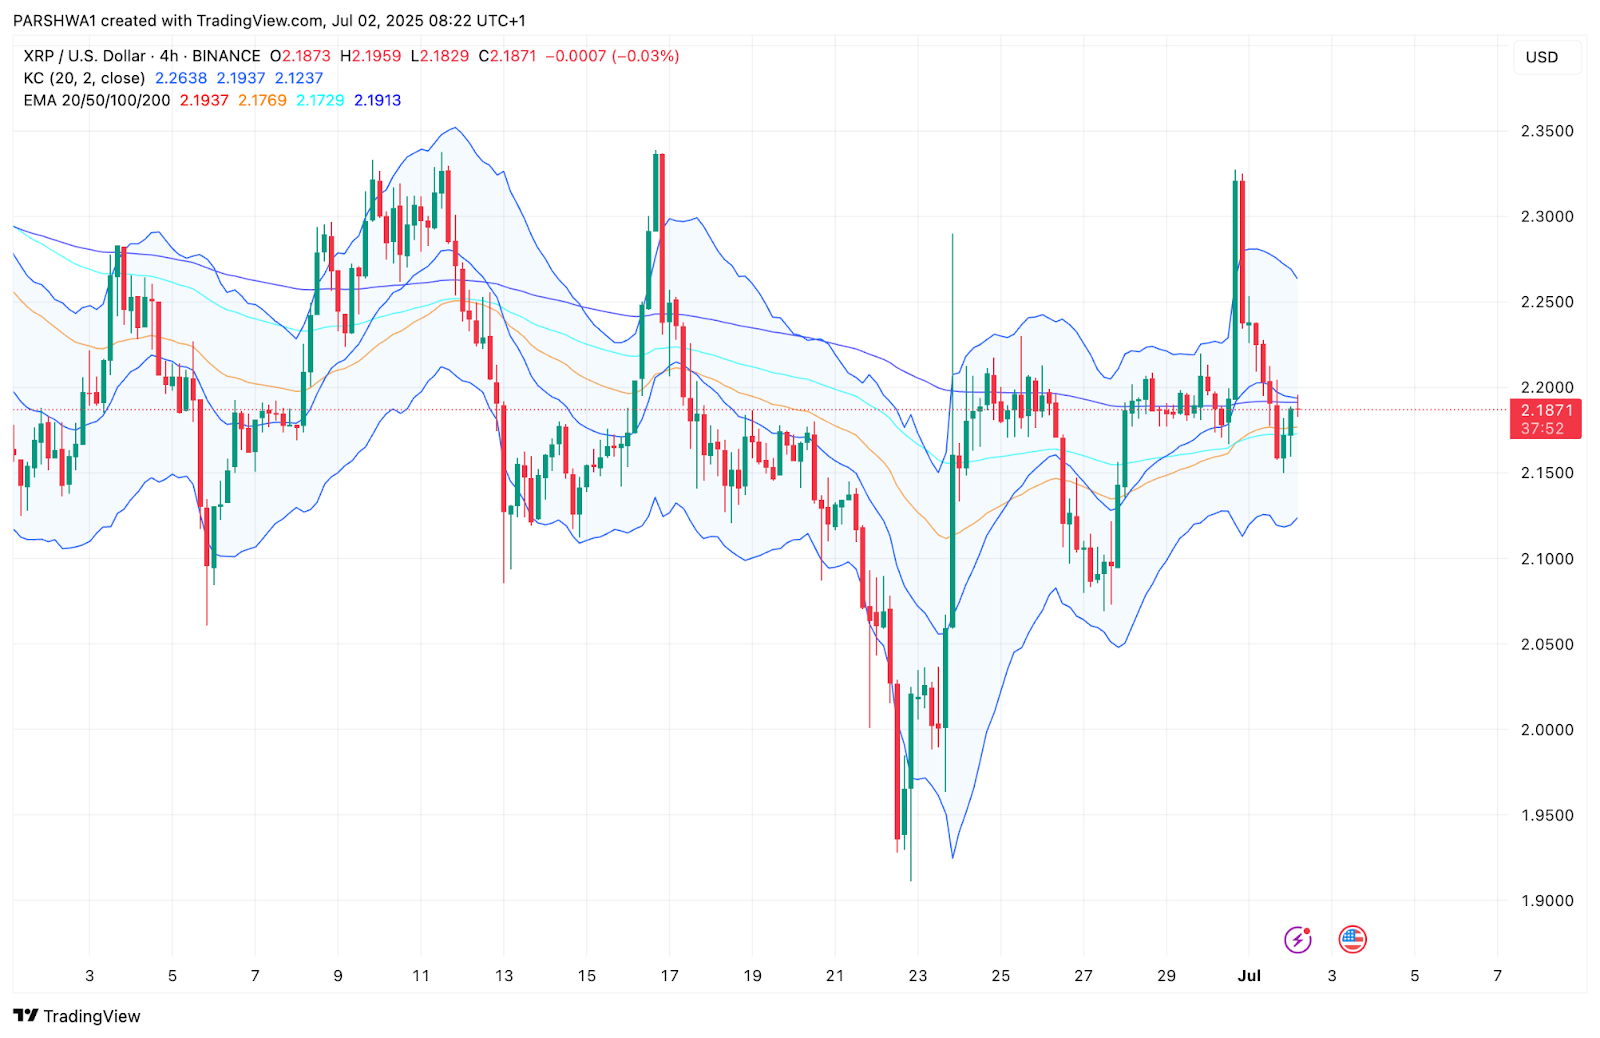
The 4-hour chart shows XRP pressing against the 50- and 100-EMA cluster between $2.17–$2.19, with price currently oscillating within the Keltner Channel. Bollinger Bands are tightening—typically a signal of imminent volatility expansion. A decisive break above $2.22 may trigger a momentum rally toward $2.25 and beyond.

However, Chaikin Money Flow (CMF) remains slightly negative at -0.07, suggesting capital inflows are still fragile. Meanwhile, the True Strength Index (TSI) is weakening from its recent peak near 10.44, indicating potential hesitation from bulls if momentum stalls near resistance.
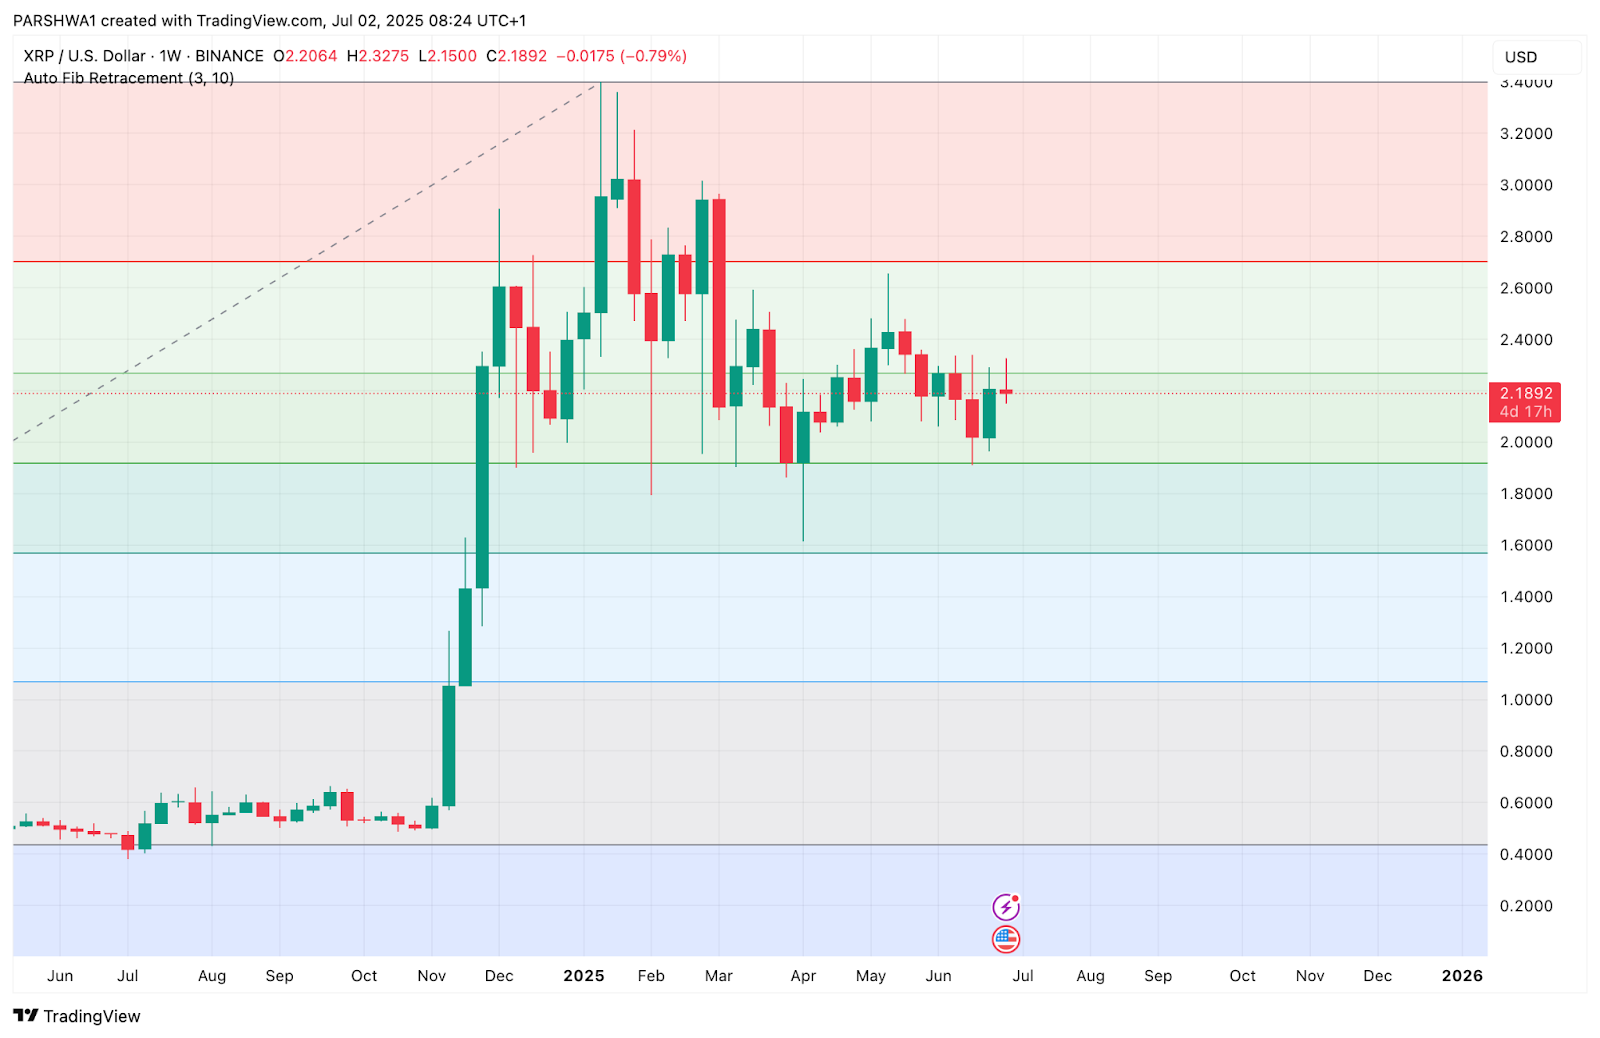
On the weekly Fibonacci retracement, XRP continues to hold above the 38.2% level near $2.08 while facing rejection near the 50% zone around $2.44. This confirms that the $2.40–$2.45 range remains the dominant resistance band.
XRP Price Prediction: Short-Term Outlook (24h)
As long as XRP continues trading above $2.10, buyers retain a slight edge in the near term. A breakout above $2.22 with volume could extend gains toward $2.30 and $2.35. But failure to clear $2.20–$2.25 may lead to another dip toward the $2.08–$2.10 support cluster.
Given the current rangebound volatility, the next move will likely depend on volume breakout from the symmetrical triangle seen on the daily structure. Traders should also watch for potential Supertrend reversal confirmation above $2.31.
XRP Price Forecast Table: July 3, 2025
| Indicator / Level | Value / Signal |
| XRP price today | $2.189 |
| Immediate Resistance | $2.22 / $2.25 / $2.31 |
| Key Support Levels | $2.15 / $2.10 / $2.03 |
| Supertrend (Daily) | Bearish below $2.31 |
| SAR (Daily) | Bullish (below price) |
| RSI (30-min) | 53.5 (neutral-bullish) |
| MACD (30-min) | Bullish crossover emerging |
| TSI (4H) | Cooling from 10.44 |
| CMF (4H) | -0.07 (neutral-bearish) |
| Bollinger Bands (4H) | Tightening – breakout near |
| Netflow (Spot, July 2) | +$5.96M inflow |
Disclaimer: The information presented in this article is for informational and educational purposes only. The article does not constitute financial advice or advice of any kind. Coin Edition is not responsible for any losses incurred as a result of the utilization of content, products, or services mentioned. Readers are advised to exercise caution before taking any action related to the company.
Source: https://coinedition.com/xrp-price-prediction-for-july-3-2025/