Bitcoin price continues to hover near $105,000, showing resilience against broader market volatility. However, the battle between bulls and bears remains unresolved as momentum indicators flash mixed signals.
What’s Happening With Bitcoin’s Price?
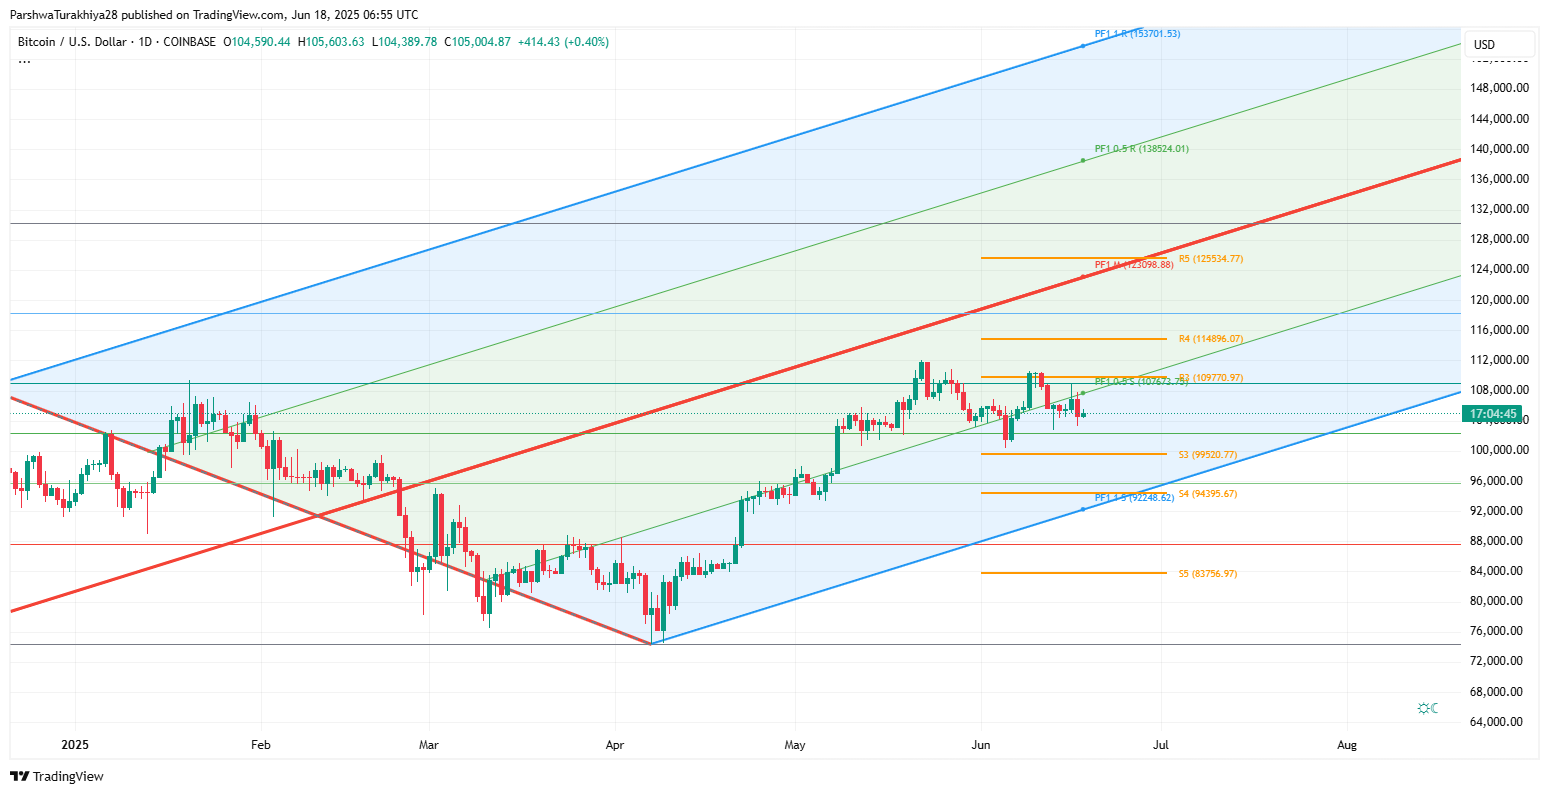

As of June 18, the Bitcoin price today is holding at approximately $104,950 after bouncing from a key short-term demand zone near $104,400. This support lies within a well-established green structure on the 4-hour and daily charts. The recent rejection from the $107,000 region shows that sellers are aggressively defending the lower high of the symmetrical triangle seen on multiple timeframes.
Why Bitcoin (BTC) Price Going Down Today?
The Bitcoin price dipped slightly today, influenced by a confluence of technical and volume-based signals. On the 4-hour timeframe, price action failed to break above the descending trendline resistance near $107,000. This zone has now aligned with the 50 EMA, capping upward attempts.
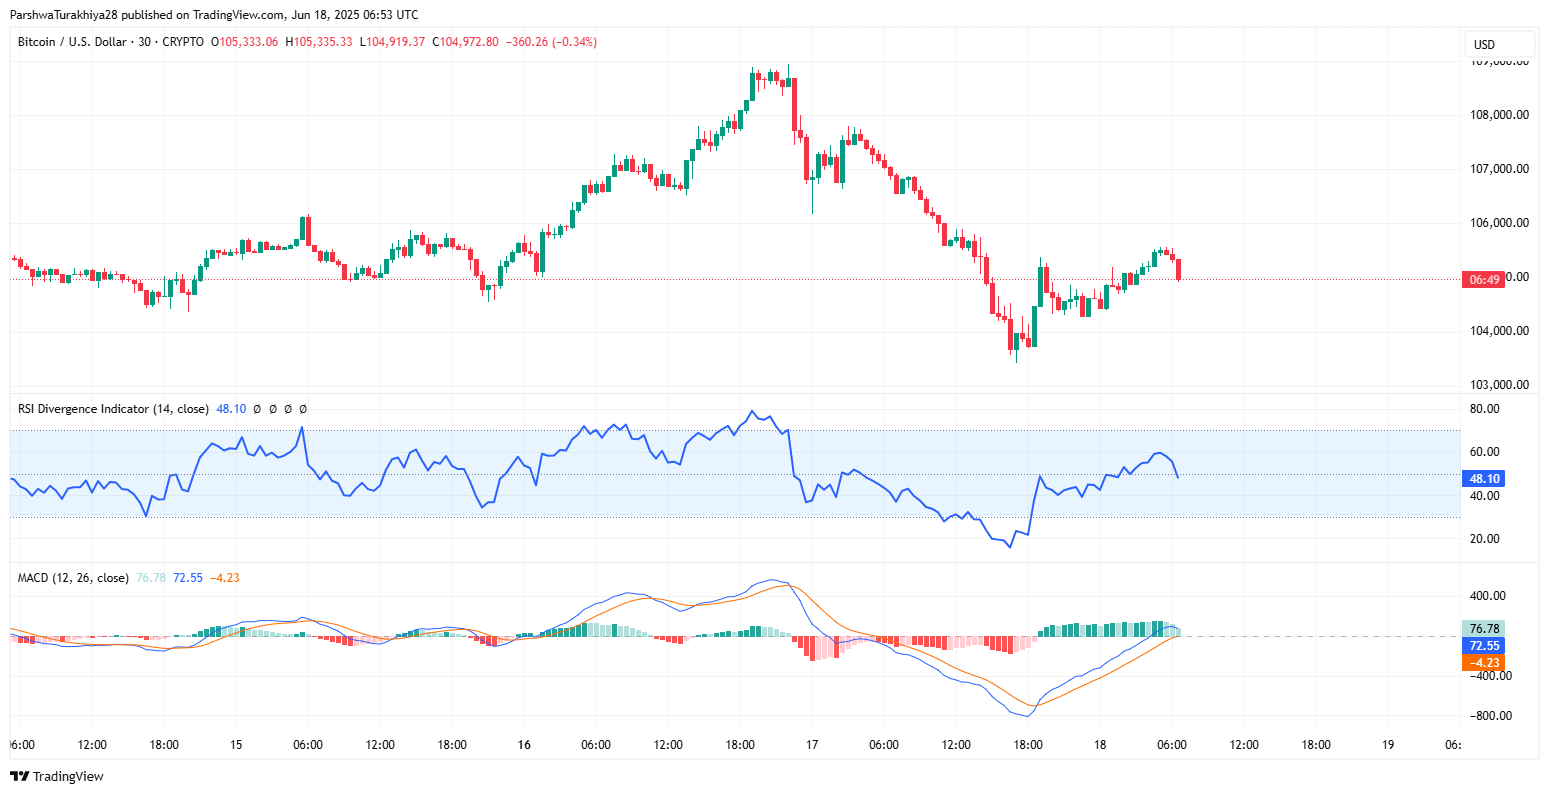
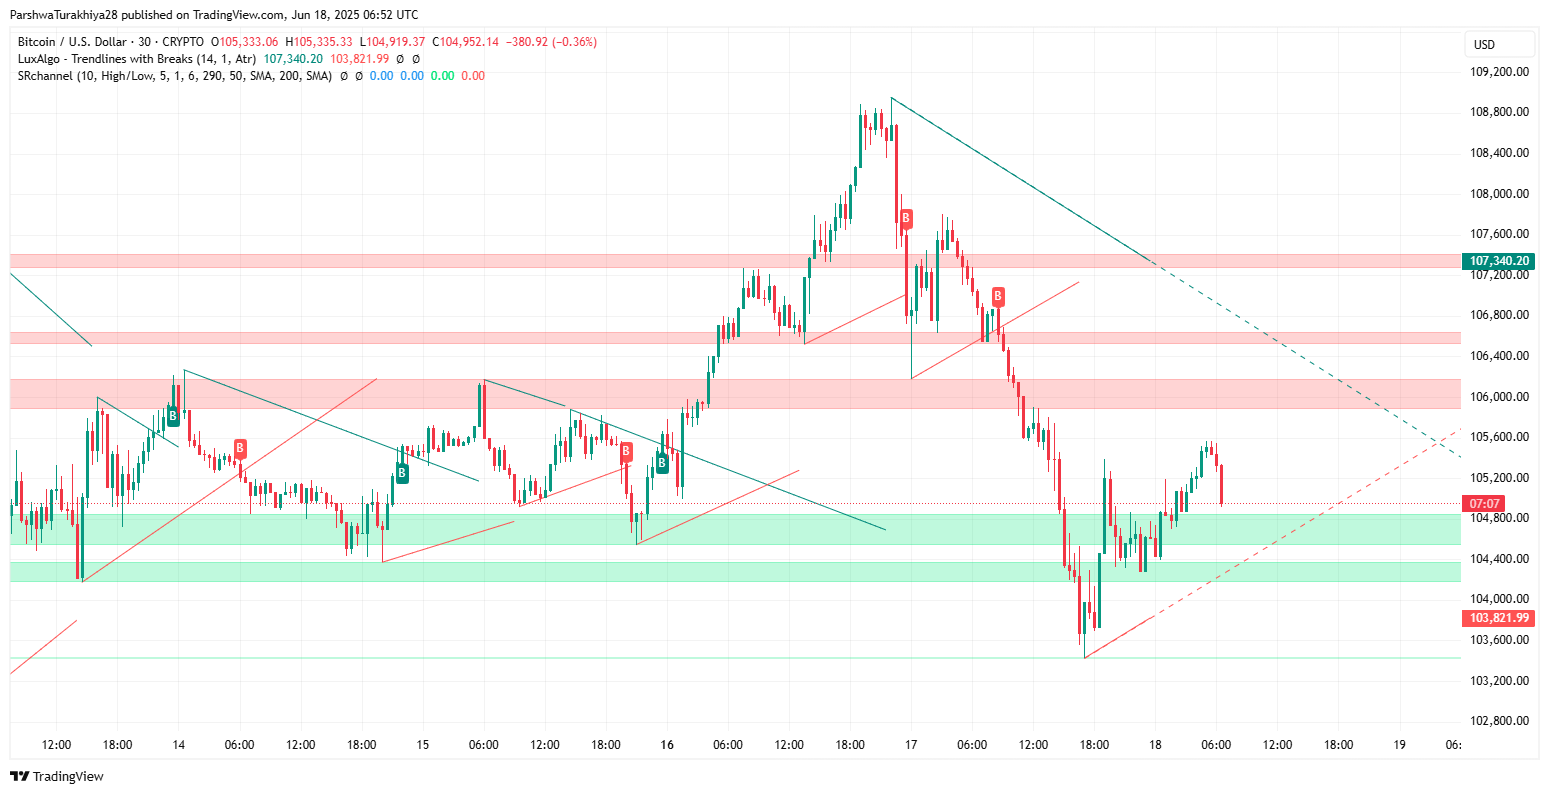
The MACD on the 30-minute chart is turning over after a bullish wave, suggesting waning upside momentum. RSI is also rolling down near the neutral 50 level, hinting at a potential intraday pullback.
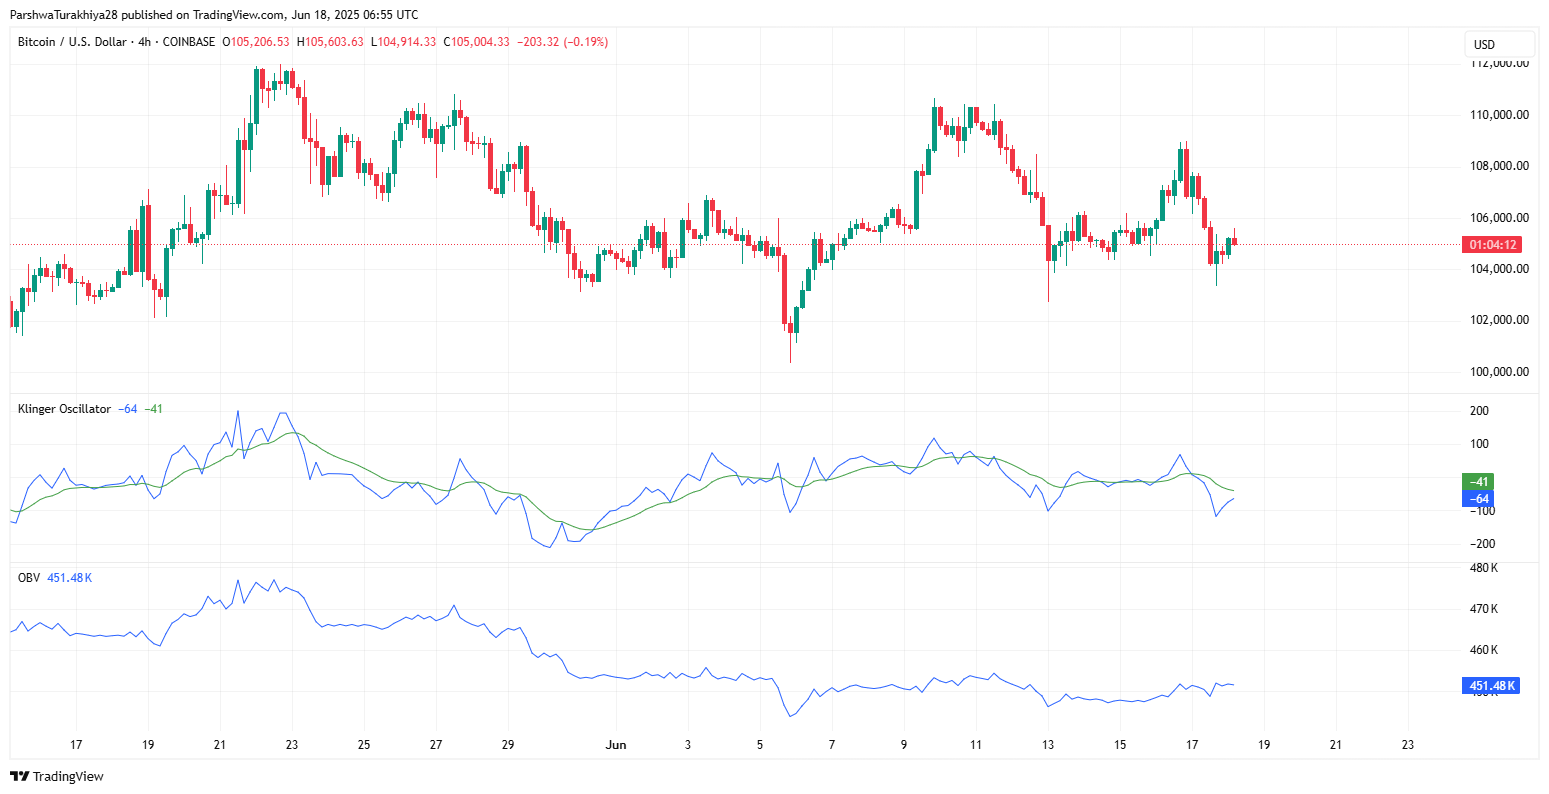
Volume is not supporting a breakout, with the Klinger Oscillator and OBV on the 4-hour showing divergence and distribution pressure.

Smart Money Concepts (SMC) indicate that Bitcoin is still under the influence of previous liquidity grabs and internal CHoCHs within the $106,800–$107,300 supply zone. This range has seen repeated equal highs and liquidity inducements, which were swept but never followed by a true bullish break of structure. That leaves Bitcoin vulnerable to further downside as uncollected sell-side liquidity still sits below $103,200.
On the 4-hour chart, a recent Break of Structure (BoS) has already occurred beneath $104,600, and the most recent price rebound is reacting to a mitigation block, not a fresh bullish impulse. Until price flips the last EQH above $107.2K with a strong close, smart money likely remains in distribution mode.
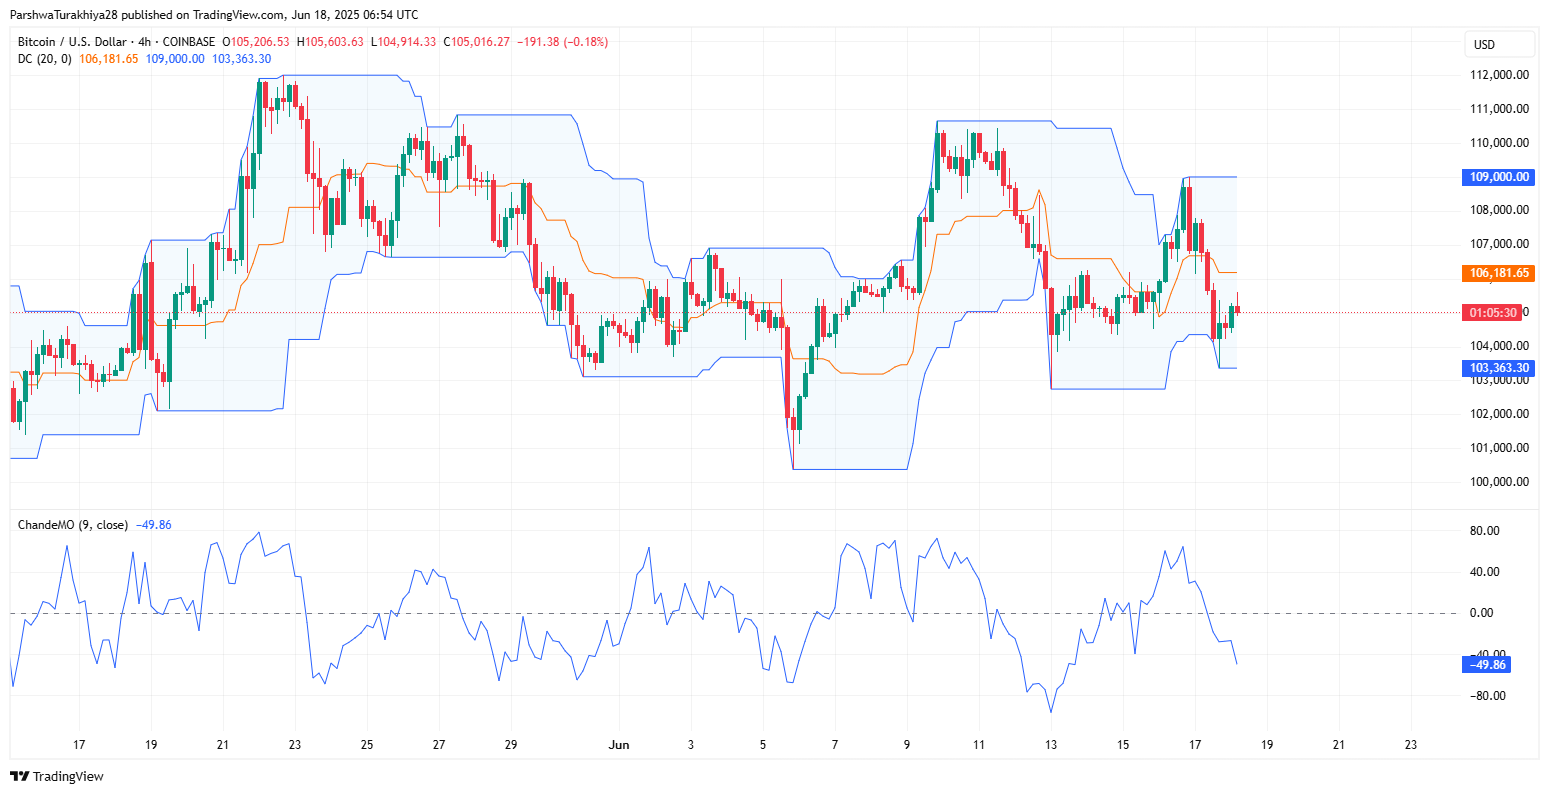
Complementing this, the Donchian Channels (DC) on the 4-hour timeframe reveal tightening volatility. The upper and lower bands are narrowing, showing price is compressing inside a volatility squeeze. The median band (basis) has turned slightly down, with the price currently rejected from the midline near $106,100. Historically, these compressions precede breakout expansions—but the current lean is slightly bearish given order flow and weak bullish follow-through.
Meanwhile, the Chande Momentum Oscillator is at -49, reinforcing the notion of a short-term bearish tilt as bulls struggle to reclaim the $106,200–$106,800 liquidity pocket.
EMA Resistance Cluster and SAR Bias Reinforce Short-Term Pressure
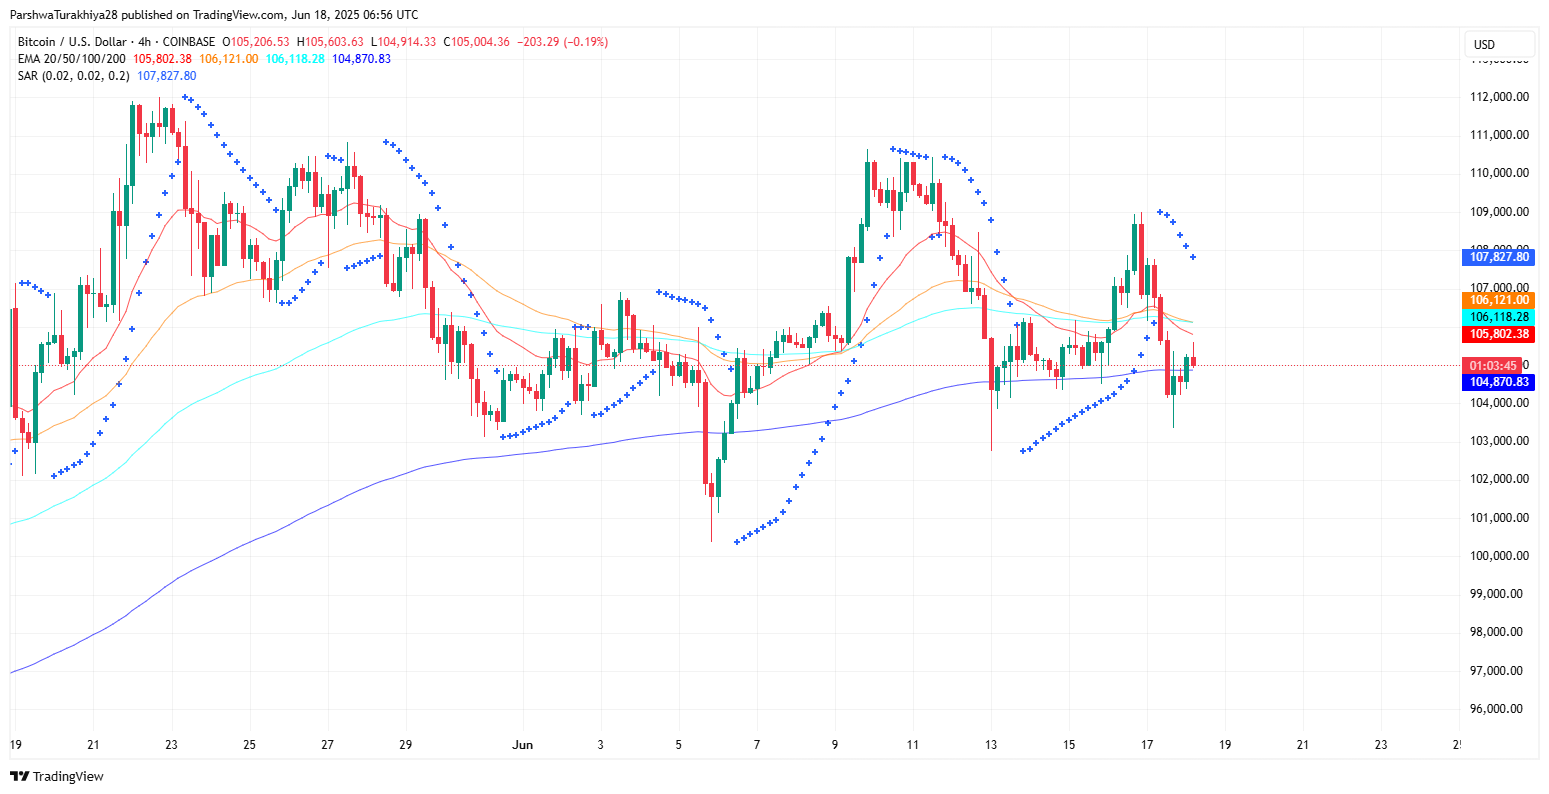
The Bitcoin price today is facing continued rejection below a dense EMA cluster on the 4-hour chart. The 20, 50, and 100 EMAs—at approximately $106,100, $106,120, and $105,800 respectively—are now converging into a tight resistance block. These moving averages are sloping downward, forming a dynamic ceiling that’s currently pinning price action below it.
Historically, when this EMA stack compresses in a downtrend, it acts as a powerful barrier, limiting upside wicks and pushing price back toward lower liquidity pools. This cluster is reinforcing the recent rejections from the $106,400 zone.
Additionally, the Parabolic SAR continues to print dots above the 4-hour candles, indicating that downward momentum remains intact. Even after the recent bounce from $104,400, the SAR has not flipped to the underside, suggesting buyers have not seized trend control. Until a candle close flips the SAR to support and price reclaims the EMA 100, bulls remain structurally sidelined.
BTC Price: Key Technical Levels to Watch

From a price structure standpoint, Bitcoin is currently trading within a larger ascending channel on the daily chart. The mid-line of this channel lies near $109,000, while the lower boundary extends toward the $95,800 support zone, aligning with the weekly Bull Market Support Band.
- Immediate resistance: $106,200, then $107,300
- Support below: $104,400 (minor), then $103,300
- Major downside support: $99,500 and $94,000
- Breakout confirmation: Above $107,800 with volume
In addition, the SMC chart shows a recent CHoCH followed by a liquidity sweep, pointing toward potential accumulation but confirmation remains pending.
Bitcoin Price Update and Forecast Outlook
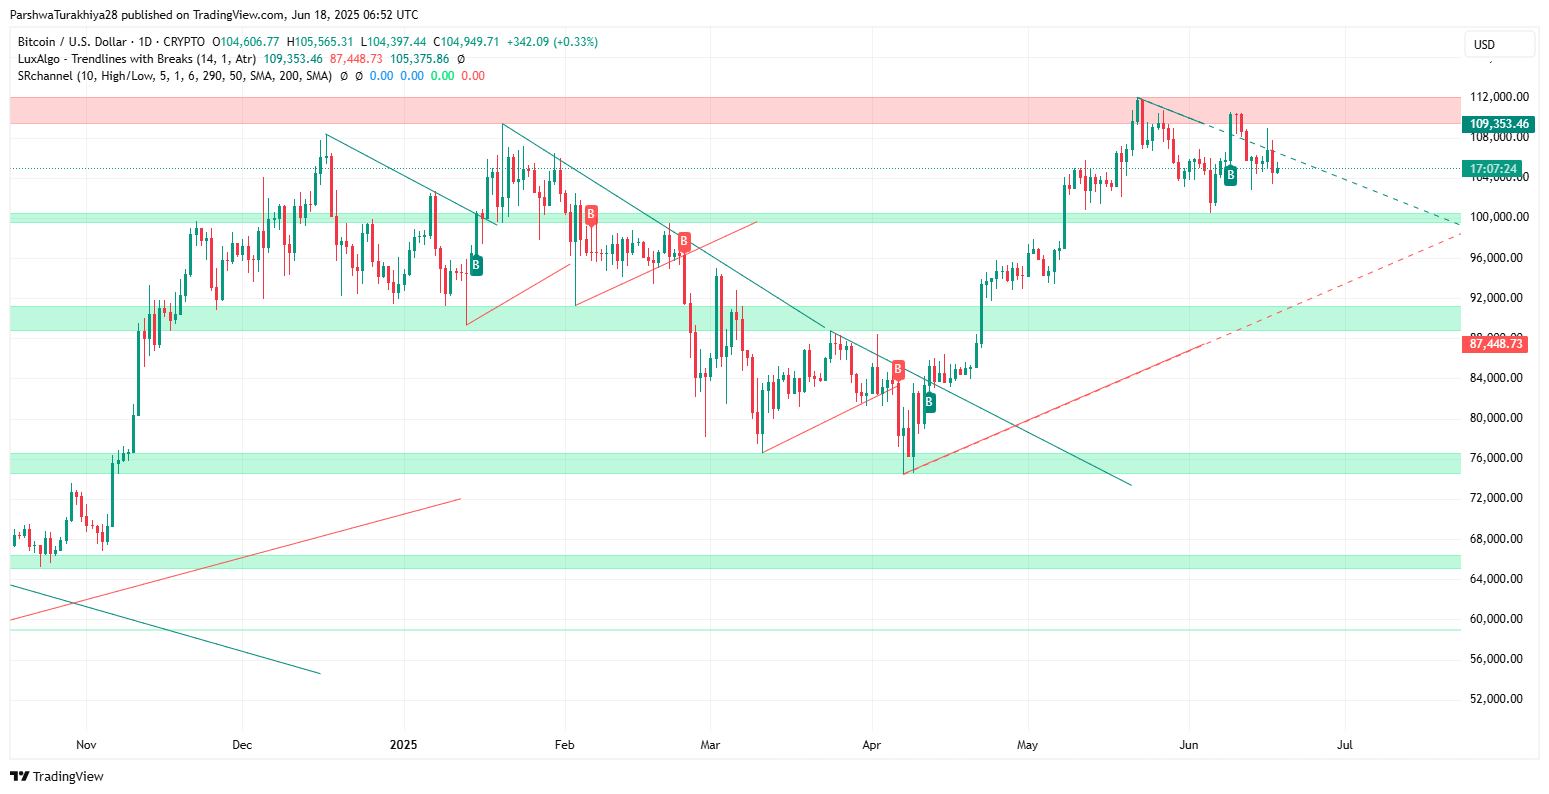
In terms of trend context, the Bitcoin price action remains confined within a medium-term compression structure. A breakout from this symmetrical triangle, especially with strong volume, could ignite a directional move. However, with the Bollinger Band Width (BBP) still tight, volatility remains suppressed.
The bullish invalidation level is clearly defined at $103,200, and a breakdown below this would open up deeper targets toward $99,000 or even $96,000 based on historical demand clusters. Conversely, a bullish reclaim of $107,800 could trigger a sharp move toward $110,000 and eventually the $114,000 resistance extension.
Bitcoin (BTC) Price Prediction Table
| Level Type | Price Zone |
| Intraday Resistance | $106,200 – $107,300 |
| Intraday Support | $104,400 – $103,300 |
| Breakout Target (Upside) | $109,000 – $114,000 |
| Downside Risk Level | $99,500 – $94,000 |
| Momentum Bias (30-min) | Bearish-Neutral |
| Momentum Bias (Daily) | Consolidating |
Disclaimer: The information presented in this article is for informational and educational purposes only. The article does not constitute financial advice or advice of any kind. Coin Edition is not responsible for any losses incurred as a result of the utilization of content, products, or services mentioned. Readers are advised to exercise caution before taking any action related to the company.
Source: https://coinedition.com/bitcoin-btc-price-prediction-for-june-19-2025/