Key Points:
- Bitcoin tests $107,500 support as TD Sequential flashes hourly buy signal.
- Double-top and falling volume hint at buyer fatigue and consolidation.
- Break above $110,718 may rally to $112,500; below $107,500 risks $102,000.


A closely followed crypto strategist says Bitcoin (BTC) has reached a critical support level that previously acted as a springboard for short-term rallies.
In a new post on social media platform X, analyst Ali Martinez highlights that BTC has hit the lower boundary of its current trading channel, around $107,500, an area where the top crypto asset has historically found support.
“#Bitcoin $BTC reached the lower boundary of its current channel, where it has previously found support, while the TD Sequential is flashing a buy signal on the hourly chart!”
Ali Martinez via X


At the time of writing, Bitcoin is trading at $108,172, slightly recovering from an earlier low after falling from the $110,700 zone.
BTC Chart Reveals Double Top and Fading Momentum
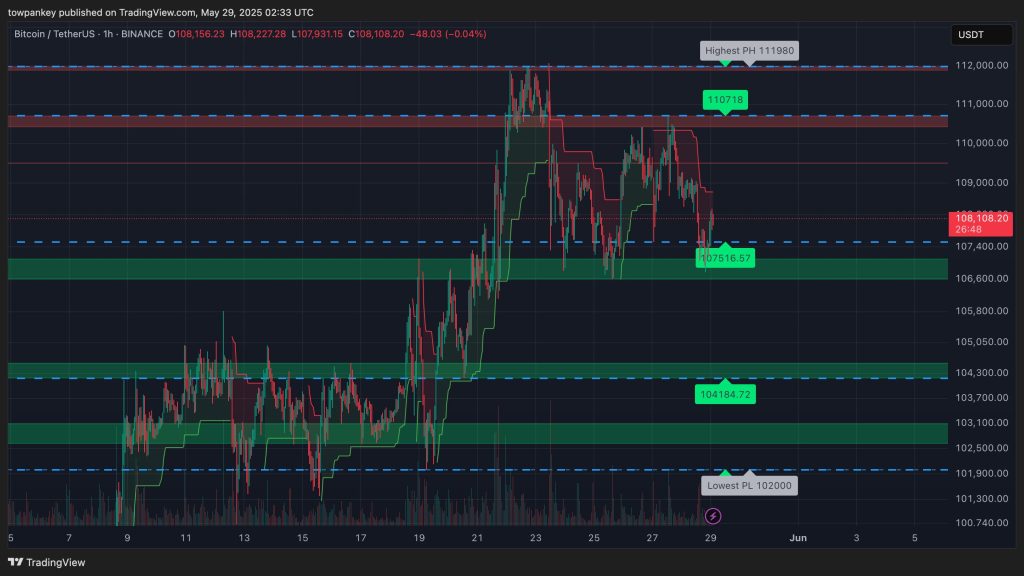
Technical analysis shows Bitcoin is moving through a consolidation-to-corrective phase after breaking its recent short-term uptrend. A clear double-top pattern formed near the $111,000–$111,980 range signals exhaustion from bulls after a sharp parabolic rise.


Lower highs and a drop toward the $107,516 demand zone followed, with a modest rebound emerging. Still, BTC remains below key resistance at $110,718, highlighting lingering caution among traders.
Candlestick and Volume Action Suggest Weakness
Recent candlestick patterns show long upper wicks and diminishing bullish momentum, suggesting buyer fatigue. While the $107,500 zone has provided a temporary bounce, the lack of strong bullish volume raises doubts about a sustained recovery.
Volume during the recent decline was steady rather than climactic, a sign that BTC may continue drifting sideways or slightly lower in the near term.
Key Scenarios to Watch
- Bullish: A break above $110,718 could open the door for a rally to $111,980 or possibly $112,500.
- Bearish: If BTC breaks below $107,500, expect further downside toward $104,184 and potentially $102,000.
- Neutral: Sideways action is likely if trading volume remains low in the $108,000–$109,000 range.
| DISCLAIMER: The information on this website is provided as general market commentary and does not constitute investment advice. We encourage you to do your own research before investing. |
Source: https://coincu.com/340391-analyst-flags-bitcoin-support-at-107k-eyes-rebound-on-buy-signal/