Key Points:
- PEPE coin price breaks trendline, confirming bullish reversal with higher highs and reclaimed support.
- Failure to hold $0.00001117 may trigger downside toward $0.00000758.
PEPE coin price’s breakout above a long-term trendline has flipped market sentiment, setting the stage for a bullish continuation as technicals align and consolidation forms above reclaimed support.
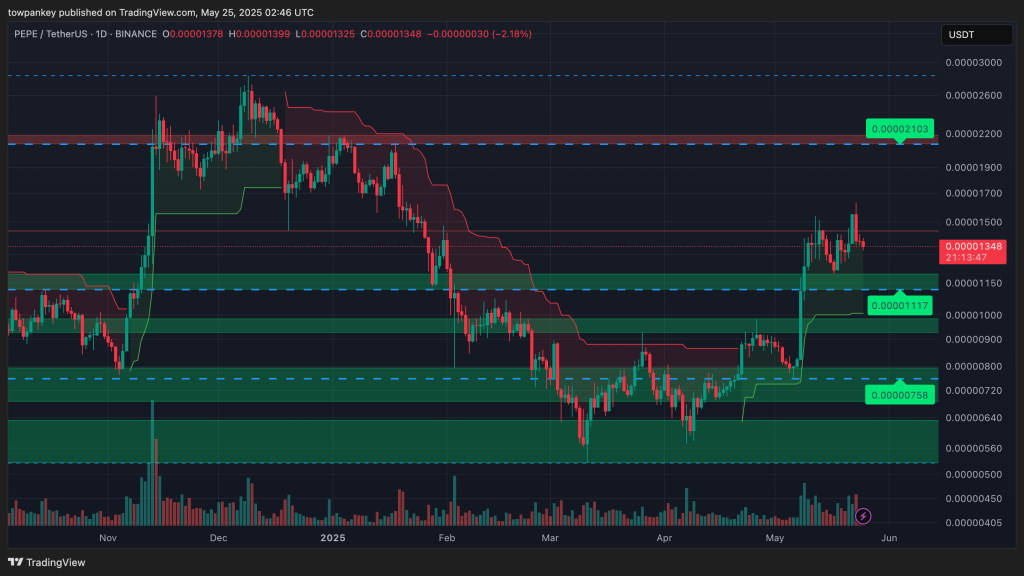
If PEPE clears $0.00001500 with volume, upside targets include $0.00001900, $0.00002103, and possibly $0.00002650. However, failure to hold $0.00001117 may shift bias bearish, with downside risk toward $0.00000758.
PEPE Breaks Trendline, Signals Start of Fresh Uptrend
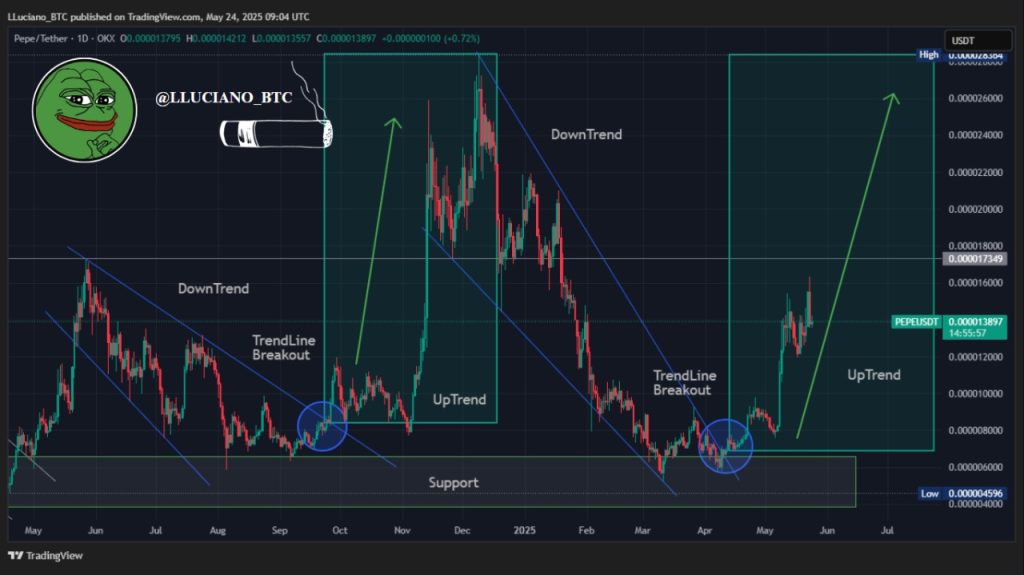
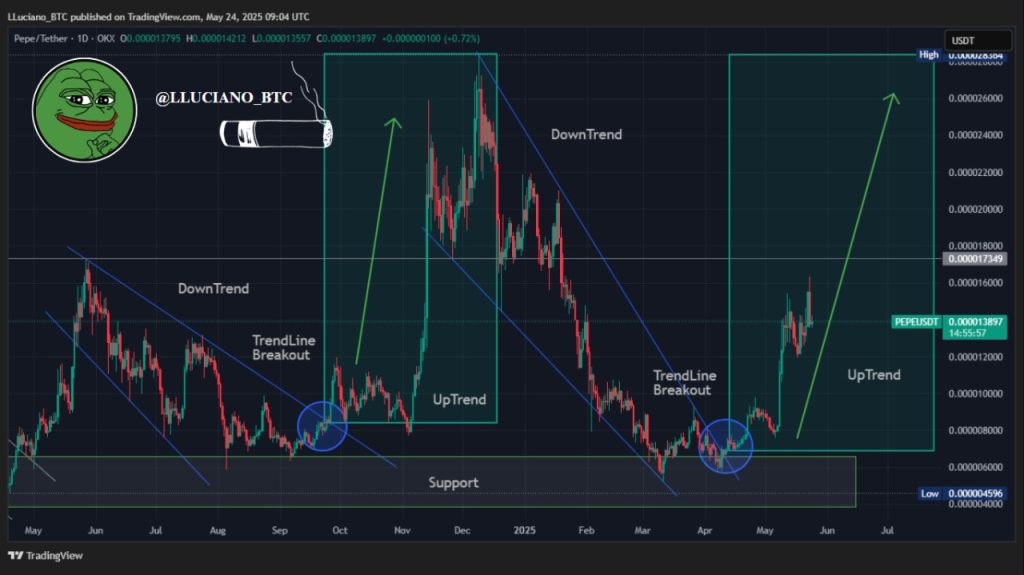
According to crypto analyst Lucky (@LLuciano_BTC), PEPE/USDT has confirmed a breakout from its prolonged downtrend, reclaiming key support around $0.0000080. The trendline breakout mirrors the setup from late 2024, which sparked a multi-week rally.


Following the move, the price advanced above $0.00001389, signalling renewed bullish strength. If PEPE maintains momentum and clears resistance at $0.00001734, it could rally as high as $0.00002650, a potential gain of over 50%.
However, a failure to hold above $0.00001117 may invalidate the breakout and drag the price back toward the $0.00000600–$0.00000800 support range.
Market Structure Shows Signs of Re-Accumulation
Technical data shows that PEPE coin price has reversed from its March–April 2025 lows near $0.00000758, forming consistent higher lows and higher highs. The breakout above $0.00001117 confirmed a bullish reversal, with the price now consolidating just under the $0.00001500 level.


Candlestick analysis shows upper wicks near resistance, suggesting profit-taking, while smaller candle bodies point to slowing momentum. Volume surged on the breakout but has tapered off, signalling potential re-accumulation before the next leg up. A break above $0.00001500 could open the door to targets at $0.00001900 and $0.00002103.
Moving Averages and ROC Strengthen Bullish Momentum
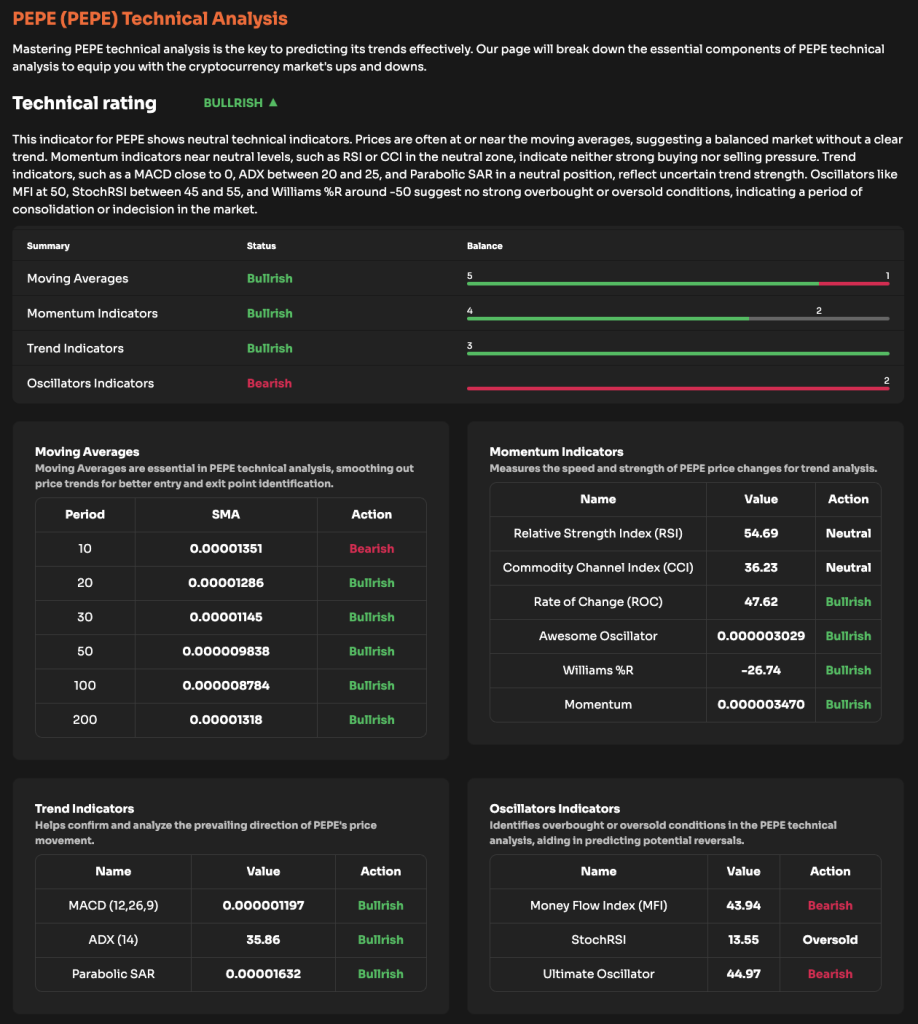
Technical indicators reinforce the bullish bias. PEPE coin price is currently trading above the 20, 30, 50, 100, and 200-period simple moving averages. Although the 10-period SMA shows minor bearish action at $0.00001351, the 200-SMA at $0.00001318 serves as solid support.


The RSI remains neutral at 54.69, suggesting further upside potential before becoming overbought. Momentum indicators like the Rate of Change (ROC) at 47.62 and the Awesome Oscillator confirm bullish acceleration. The MACD also stays in positive territory, while the Parabolic SAR prints below the price, both signalling a continuation of the trend. ADX at 35.86 confirms the presence of a strong trend.
While oscillators such as the Money Flow Index (MFI) and StochRSI reflect short-term cooling, they may signal a healthy pause within the broader uptrend.
PEPE Price Prediction
- Bullish scenario: A clean breakout above $0.00001500 may lead to rallies toward $0.00001900 and $0.00002103. Sustained volume could push PEPE to $0.00002650.
- Bearish scenario: A drop below $0.00001117 may invalidate the bullish thesis, with downside targets at $0.00000758.
- Neutral scenario: Consolidation between $0.00001300 and $0.00001500 may continue until fresh volume or external catalysts emerge.
| DISCLAIMER: The information on this website is provided as general market commentary and does not constitute investment advice. We encourage you to do your own research before investing. |
Source: https://coincu.com/339540-is-pepe-coin-set-to-rally-toward-0-00002650/