- Solana, XRP, SUI attract attention due to notable price movements.
- Solana’s 8.65% surge highlights increasing trading interest.
- SUI leads with a 19.42% price increase, signaling robust momentum.


SOL, XRP, and SUI exhibit significant bullish momentum as each breaks from prolonged downtrends, with SOL testing a key resistance zone, XRP attempting to exit its range, and SUI making a decisive breakout.
SOL testing a $157–$166 supply zone, with strong volumes suggesting institutional interest. XRP challenges $2.36 resistance, looking for confirmation. SUI breaks above $2.83, setting the stage for a run towards $5.36. Analyst eyes focus on breakout confirmations.
Solana Price Jumps 8.65% with Overbought Signals
Solana’s price surged by 8.65% to $158.83, driven by increased trading volume reaching $6,576,931,663. With a market cap of $82,435,701,776, its dominance rose to 2.62%, marking a 5.05% weekly gain.
The RSI at 73.61 suggests overbought conditions, while a CCI of 181.48 indicates neutrality. Despite the bullish StochRSI at 35.88, the MACD’s bearish 4.67 signals caution amid possible upside potential.
Solana (SOL) Technical Analysis
SOL has recently reversed from a prolonged downtrend that began in late December 2024. After forming a double bottom near the $115–$120 range, price surged sharply and is now testing a key supply zone near $157–$166. This area aligns with previous structural support turned resistance from earlier consolidation.
The current price action shows an aggressive push upwards (+7.88%) on the daily, signaling a potential breakout attempt from a multi-week accumulation base.
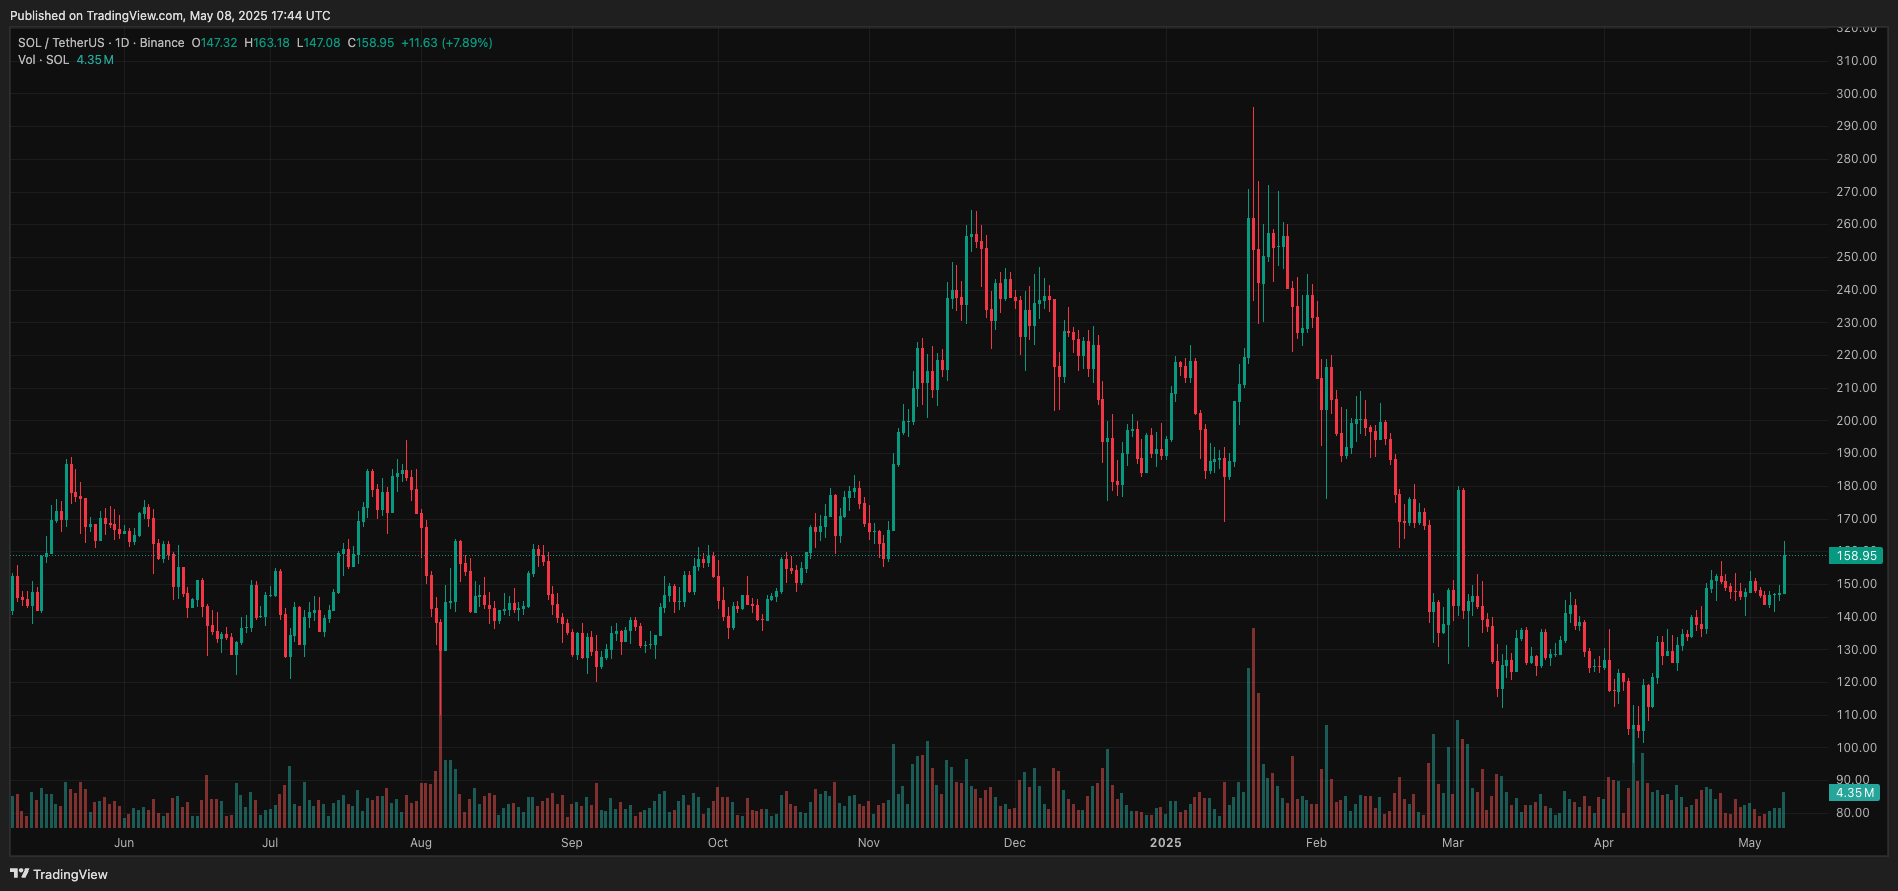

The latest daily candle is a wide-bodied bullish candle with minimal upper wick, closing near the high. This signals strong buying conviction. Volume has also surged, confirming institutional interest and reducing the odds of a fake breakout.
Previous candles showed consolidation with tight ranges and decreasing volume—typical signs of absorption before expansion.
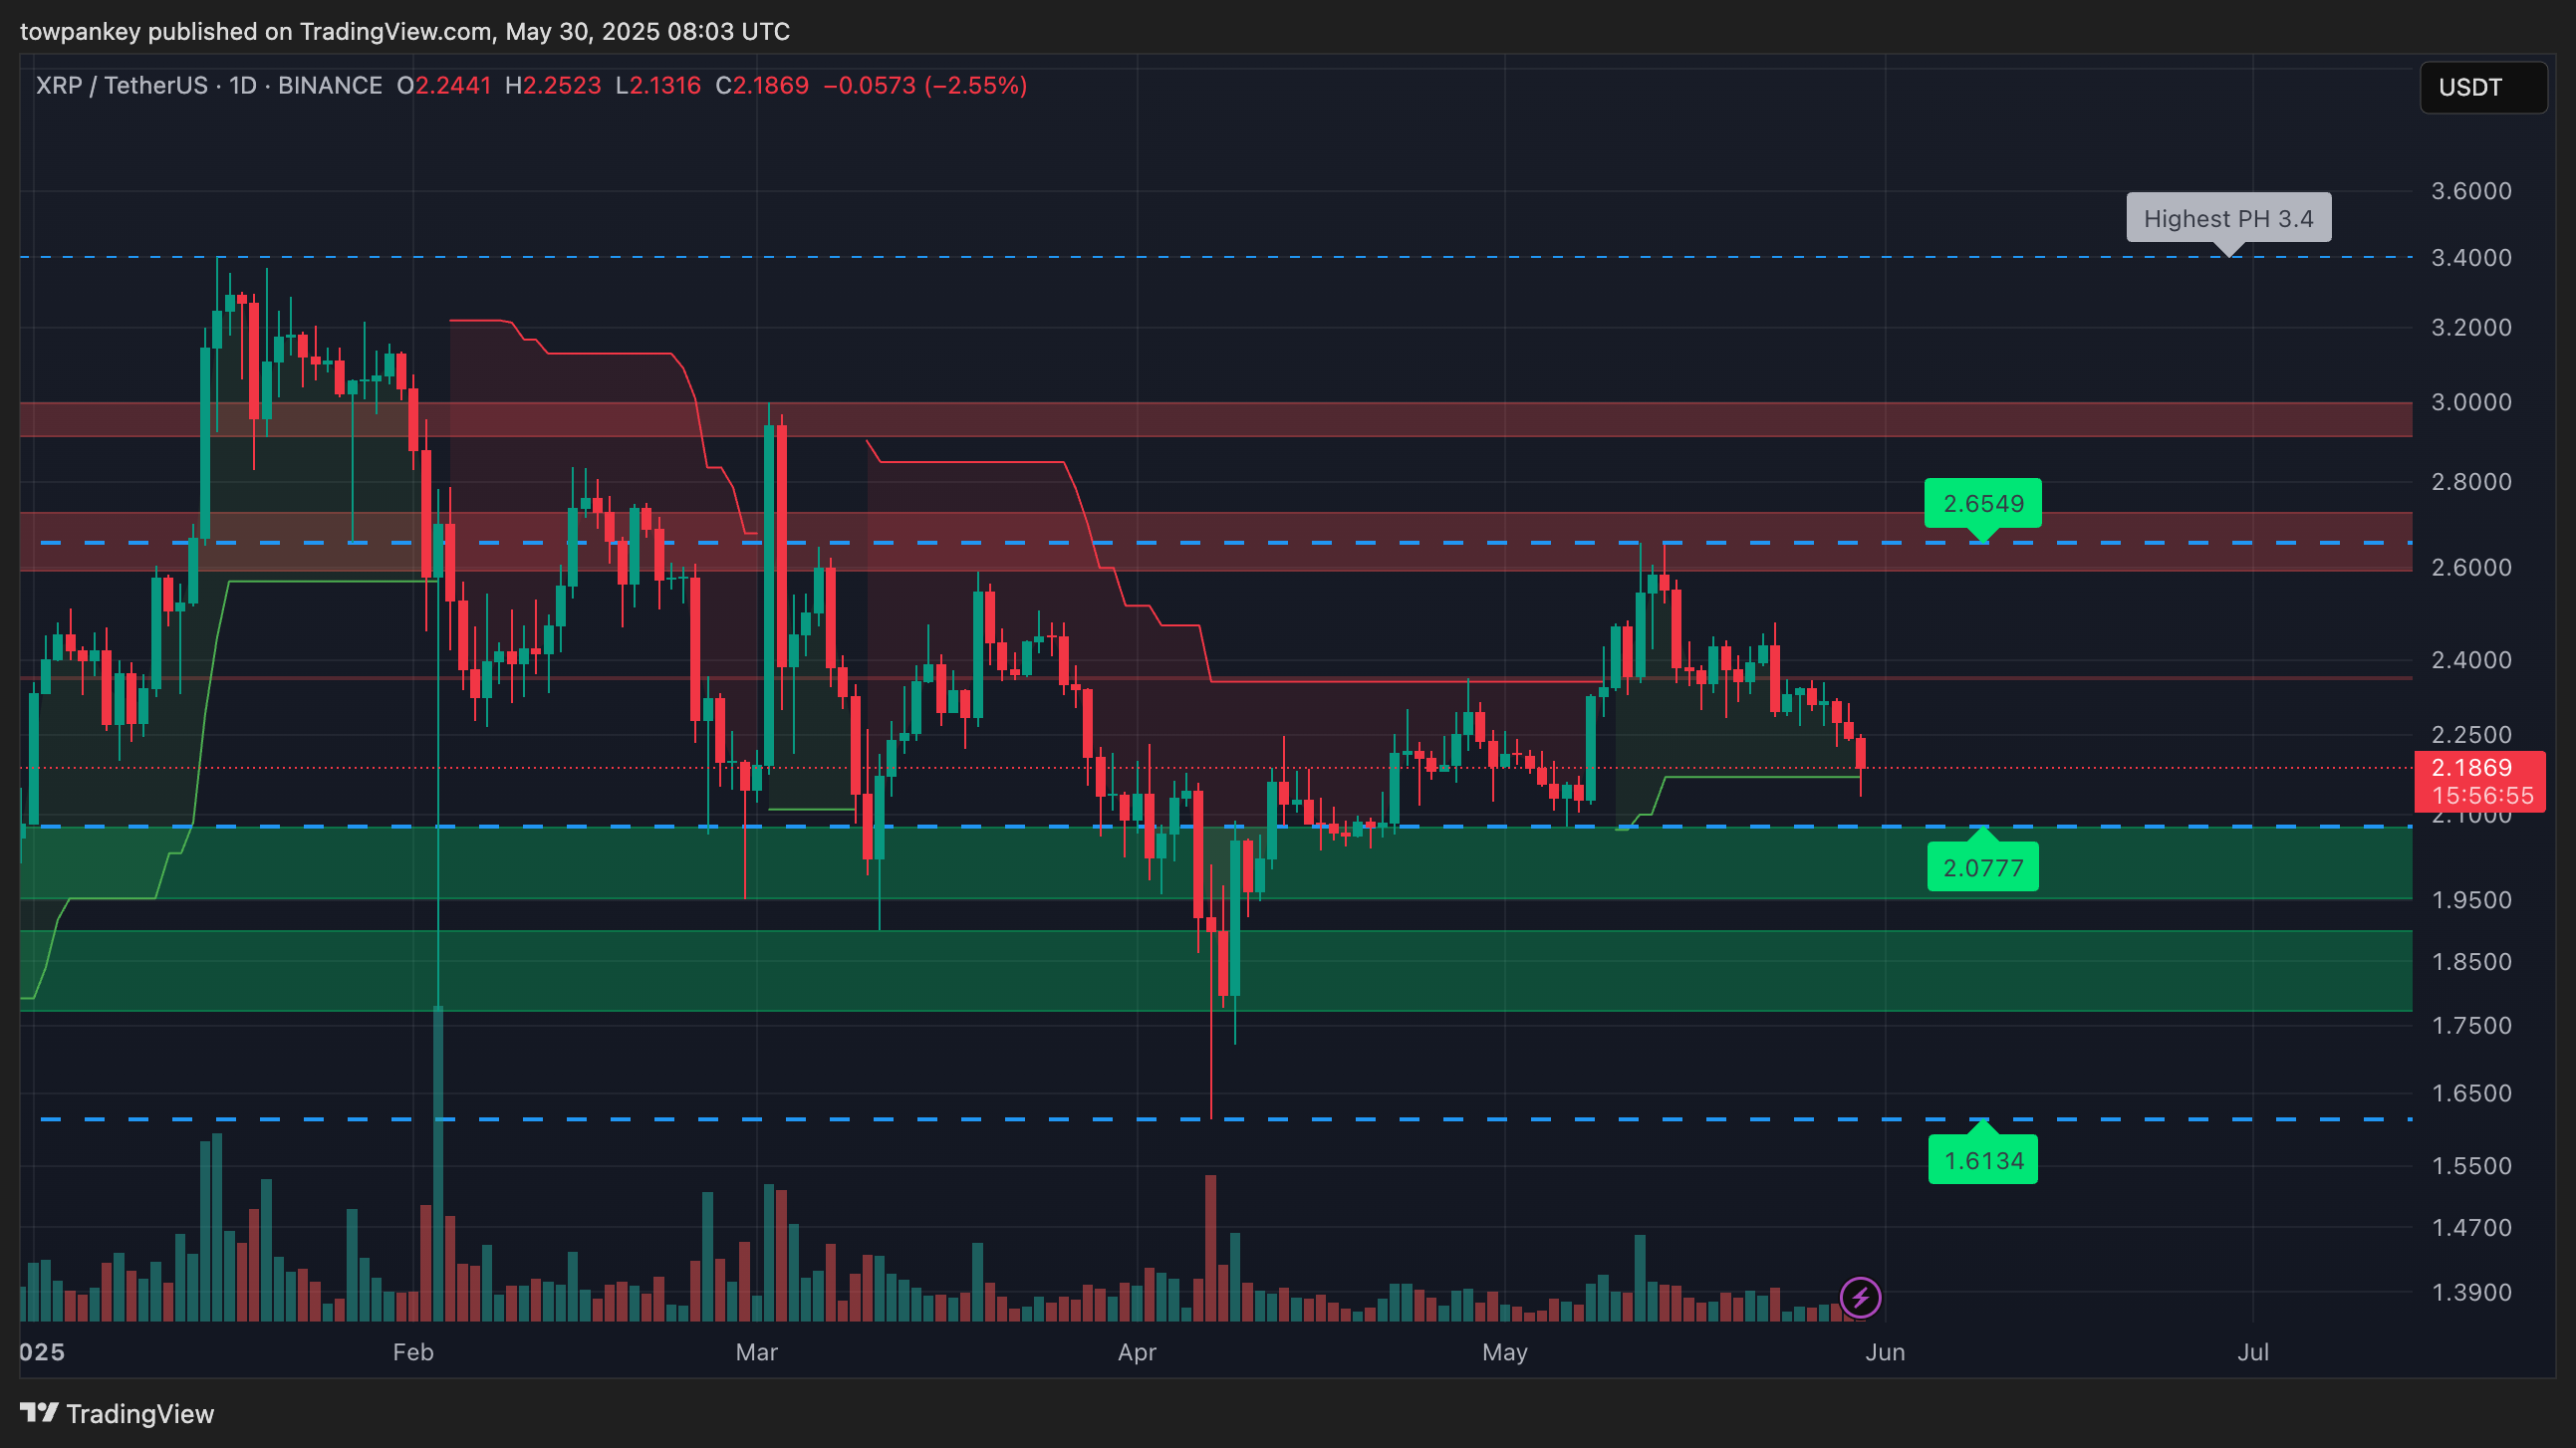

Solana Price Action Scenarios
- Bullish: If price breaks and holds above $166, it may rally toward $190 and extend to $247.
- Bearish:If the $157 support (now flipped) fails, price could drop back to the $133.11 level or deeper into the $120–$115 demand zone.
- Neutral: Sideways movement likely if volume dries near the $157–$166 band, suggesting indecision or trap formation.
Read more: Solana (SOL) Price Prediction Tomorrow and Next Week
XRP Stable Yet Gains 5.15% Despite Bearish Signals
XRP is trending with a 24-hour change of 5.15%, priced at $2.23. Trading volume surged to $5,085,475,121, capturing 4.15% market dominance. Weekly gain remains minimal at 0.02%; momentum appears neutral.
XRP’s RSI at 57.80 and CCI at 38.38 suggest stability. MACD shows bearish at 0.007162, with ADX neutral at 11.49. Support stands uncertain; potential upside targets lack clear definition recently.
XRP (XRP) Technical Analysis
XRP has been consolidating in a sideways range between ~$2.00 and ~$2.36 since mid-March, following a downtrend from its February highs. The recent price action shows a breakout attempt from this range, with the current candle pushing up aggressively toward the $2.36 resistance—an important level that previously acted as both support and resistance.
If this breakout sustains, it would mark a shift in trend sentiment, potentially ending the prolonged range-bound movement.
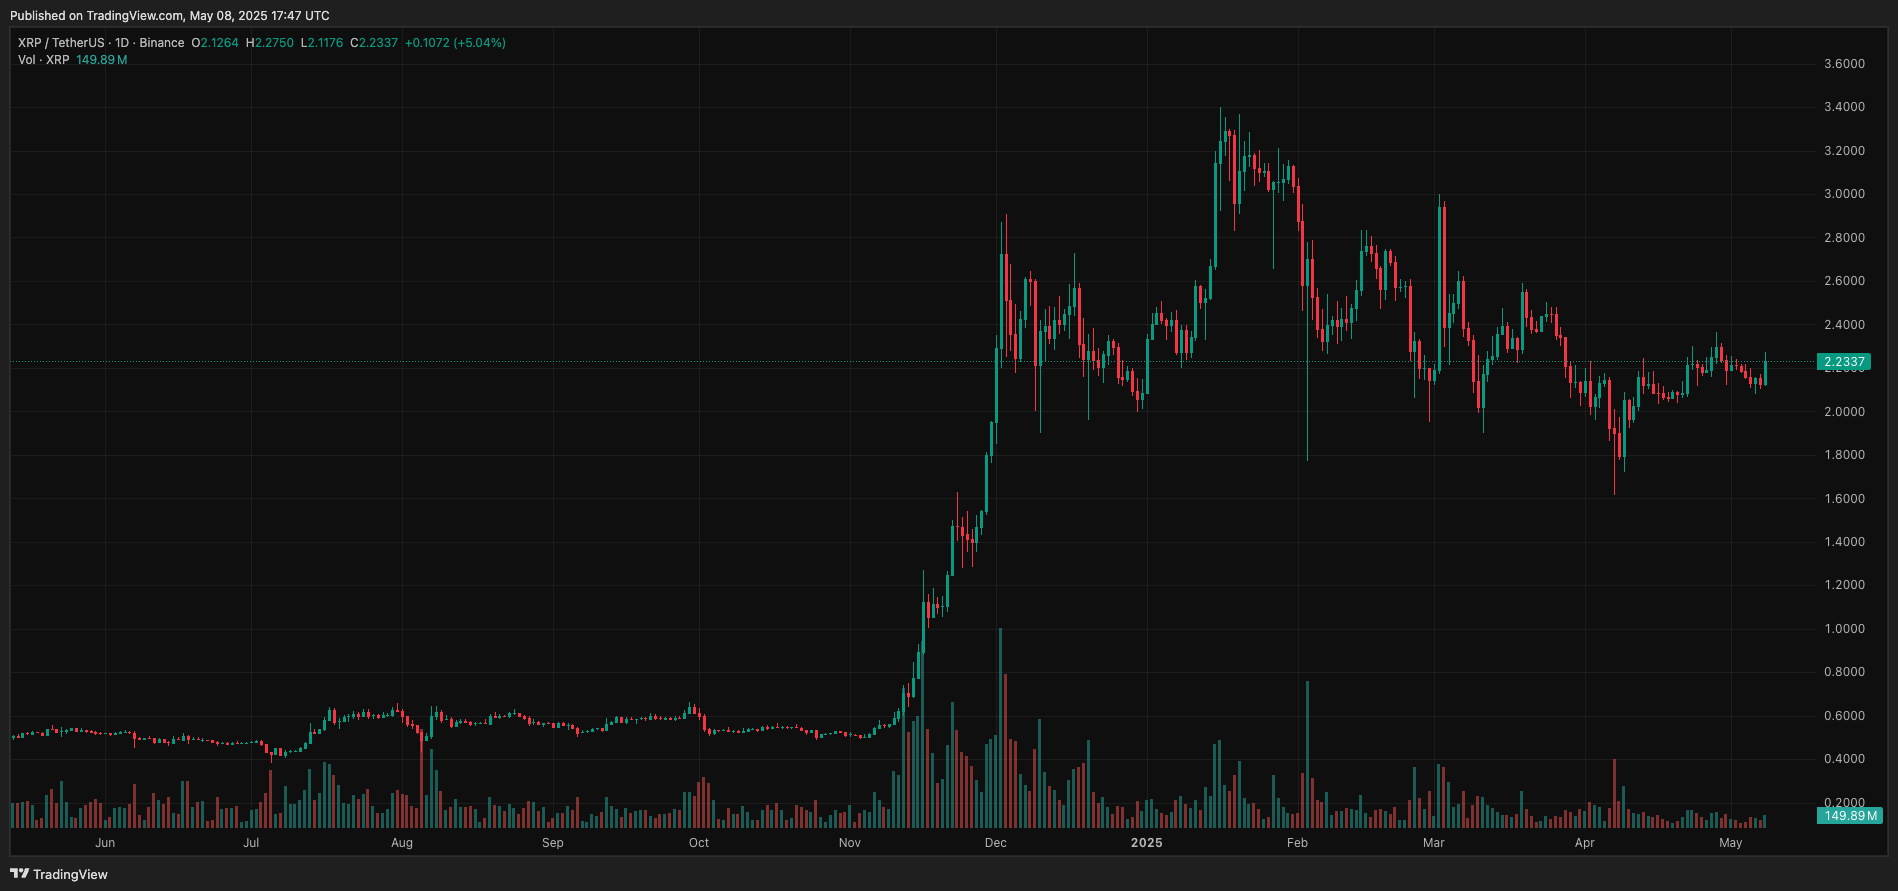

Today’s candle is a strong bullish engulfing type, closing near the high with nearly +5% gains. Volume is moderately elevated compared to the last two weeks, indicating renewed interest. Previous candles exhibited indecision and tight-range behavior, forming a base.
This breakout candle piercing into resistance reflects bullish intent, but confirmation via follow-through or a successful retest will be key.
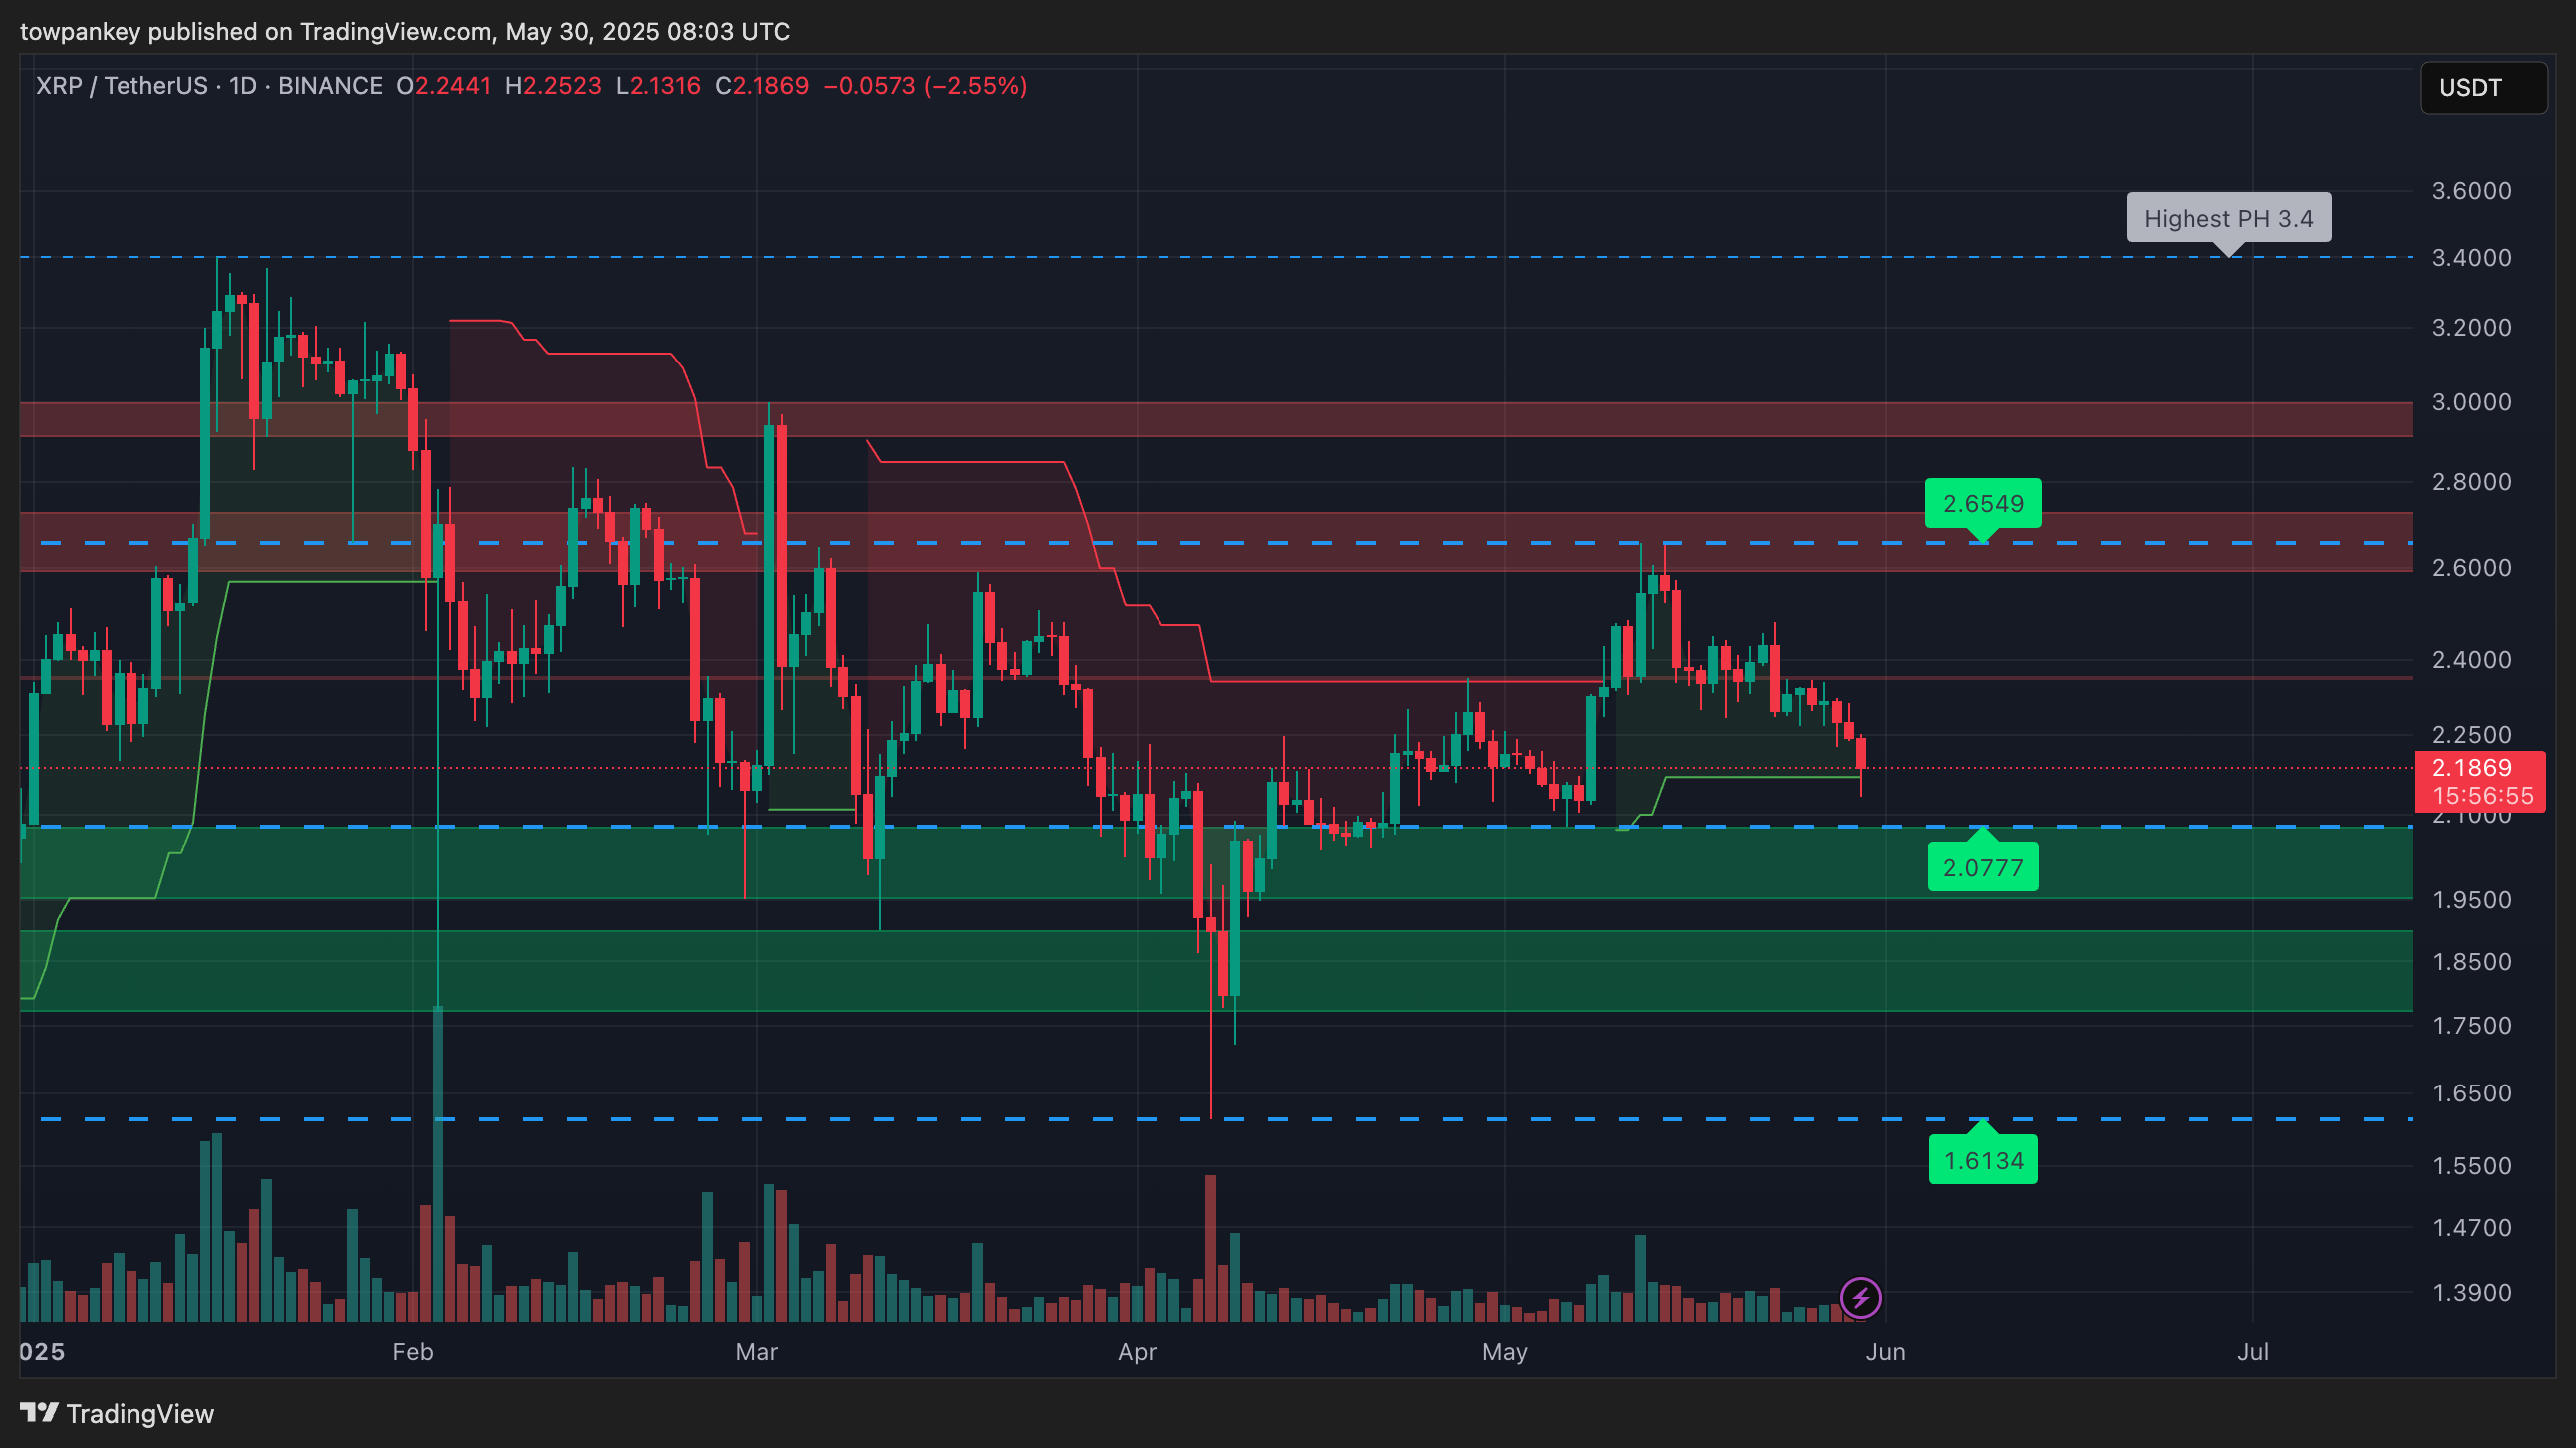

XRP Price Action Scenarios
- Bullish: If price breaks and holds above $2.36, upside continuation could target $2.60 and eventually $3.00
- Bearish:If rejection occurs at $2.36, price could slide back to $2.00 or deeper to the $1.85–$1.75 demand zone
- Neutral: Consolidation between $2.15–$2.36 likely if volume fades after the current push
Read more: XRP (XRP) Price Prediction Tomorrow and Next Week
SUI Surges 19.42% on Bullish Market Sentiment
Sui (SUI) is trending, up 19.42% to $3.91. Its trading volume surged 93.88% to $2,818,347,678. The short-term sentiment is bullish as MACD shows 0.2868, indicating upside continuation alongside a 6.29% weekly gain.
Technical indicators suggest caution as RSI is at 76.72, with MFI at 37.47. StochRSI is 30.30, while SMA alignment (10-200) remains bullish. ADX at 30.41 reflects uncertain trend strength, hinting at possible overbought conditions.
Read more: Sui (SUI) Price Prediction Tomorrow and Next Week
Sui (SUI) Technical Analysis
SUI has broken out decisively from a long multi-month downtrend that bottomed near $1.70. After reclaiming the $2.83 resistance-turned-support, price launched aggressively and is now printing a strong continuation candle above the recent consolidation highs.
This shift marks the first higher high since early February, suggesting the emergence of a new bullish trend. The path toward the previous swing high near $5.36 is now technically open.
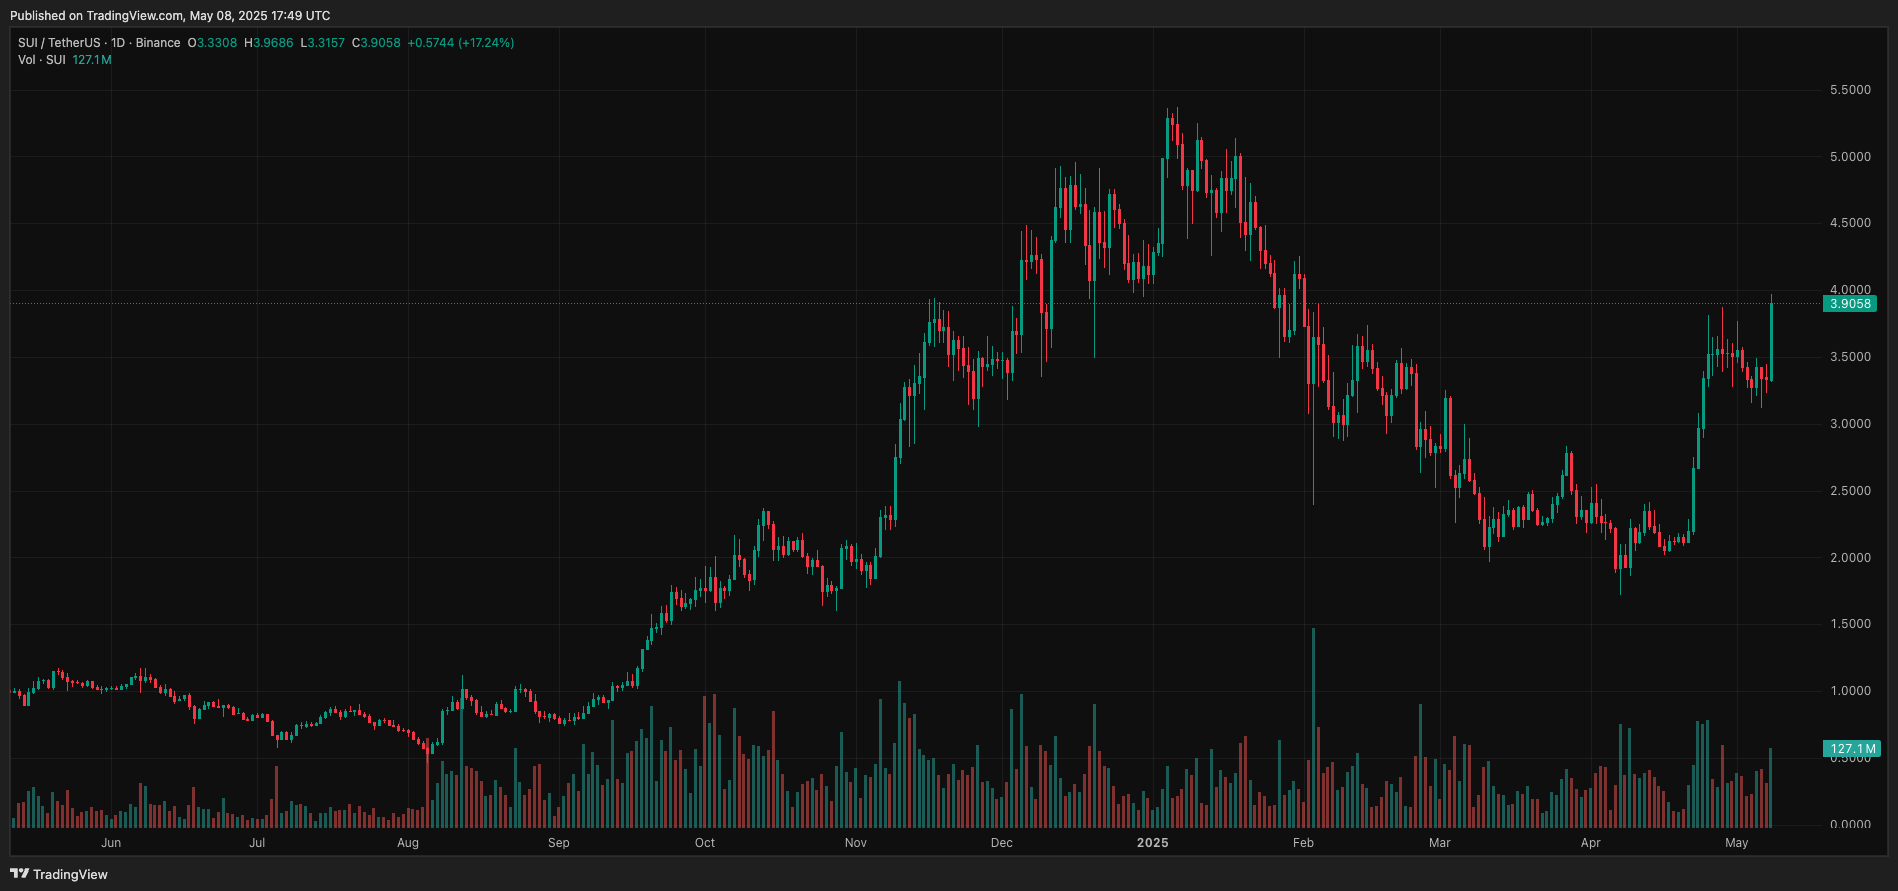

Today’s candle is extremely bullish: large-bodied, minimal upper wick, and a breakout from prior congestion. Volume has surged in tandem, reinforcing the validity of the move and pointing to strong demand absorption.
The breakout from the recent sideways range around $3.00 confirms a continuation pattern. Previous volume buildup below resistance hinted at accumulation.
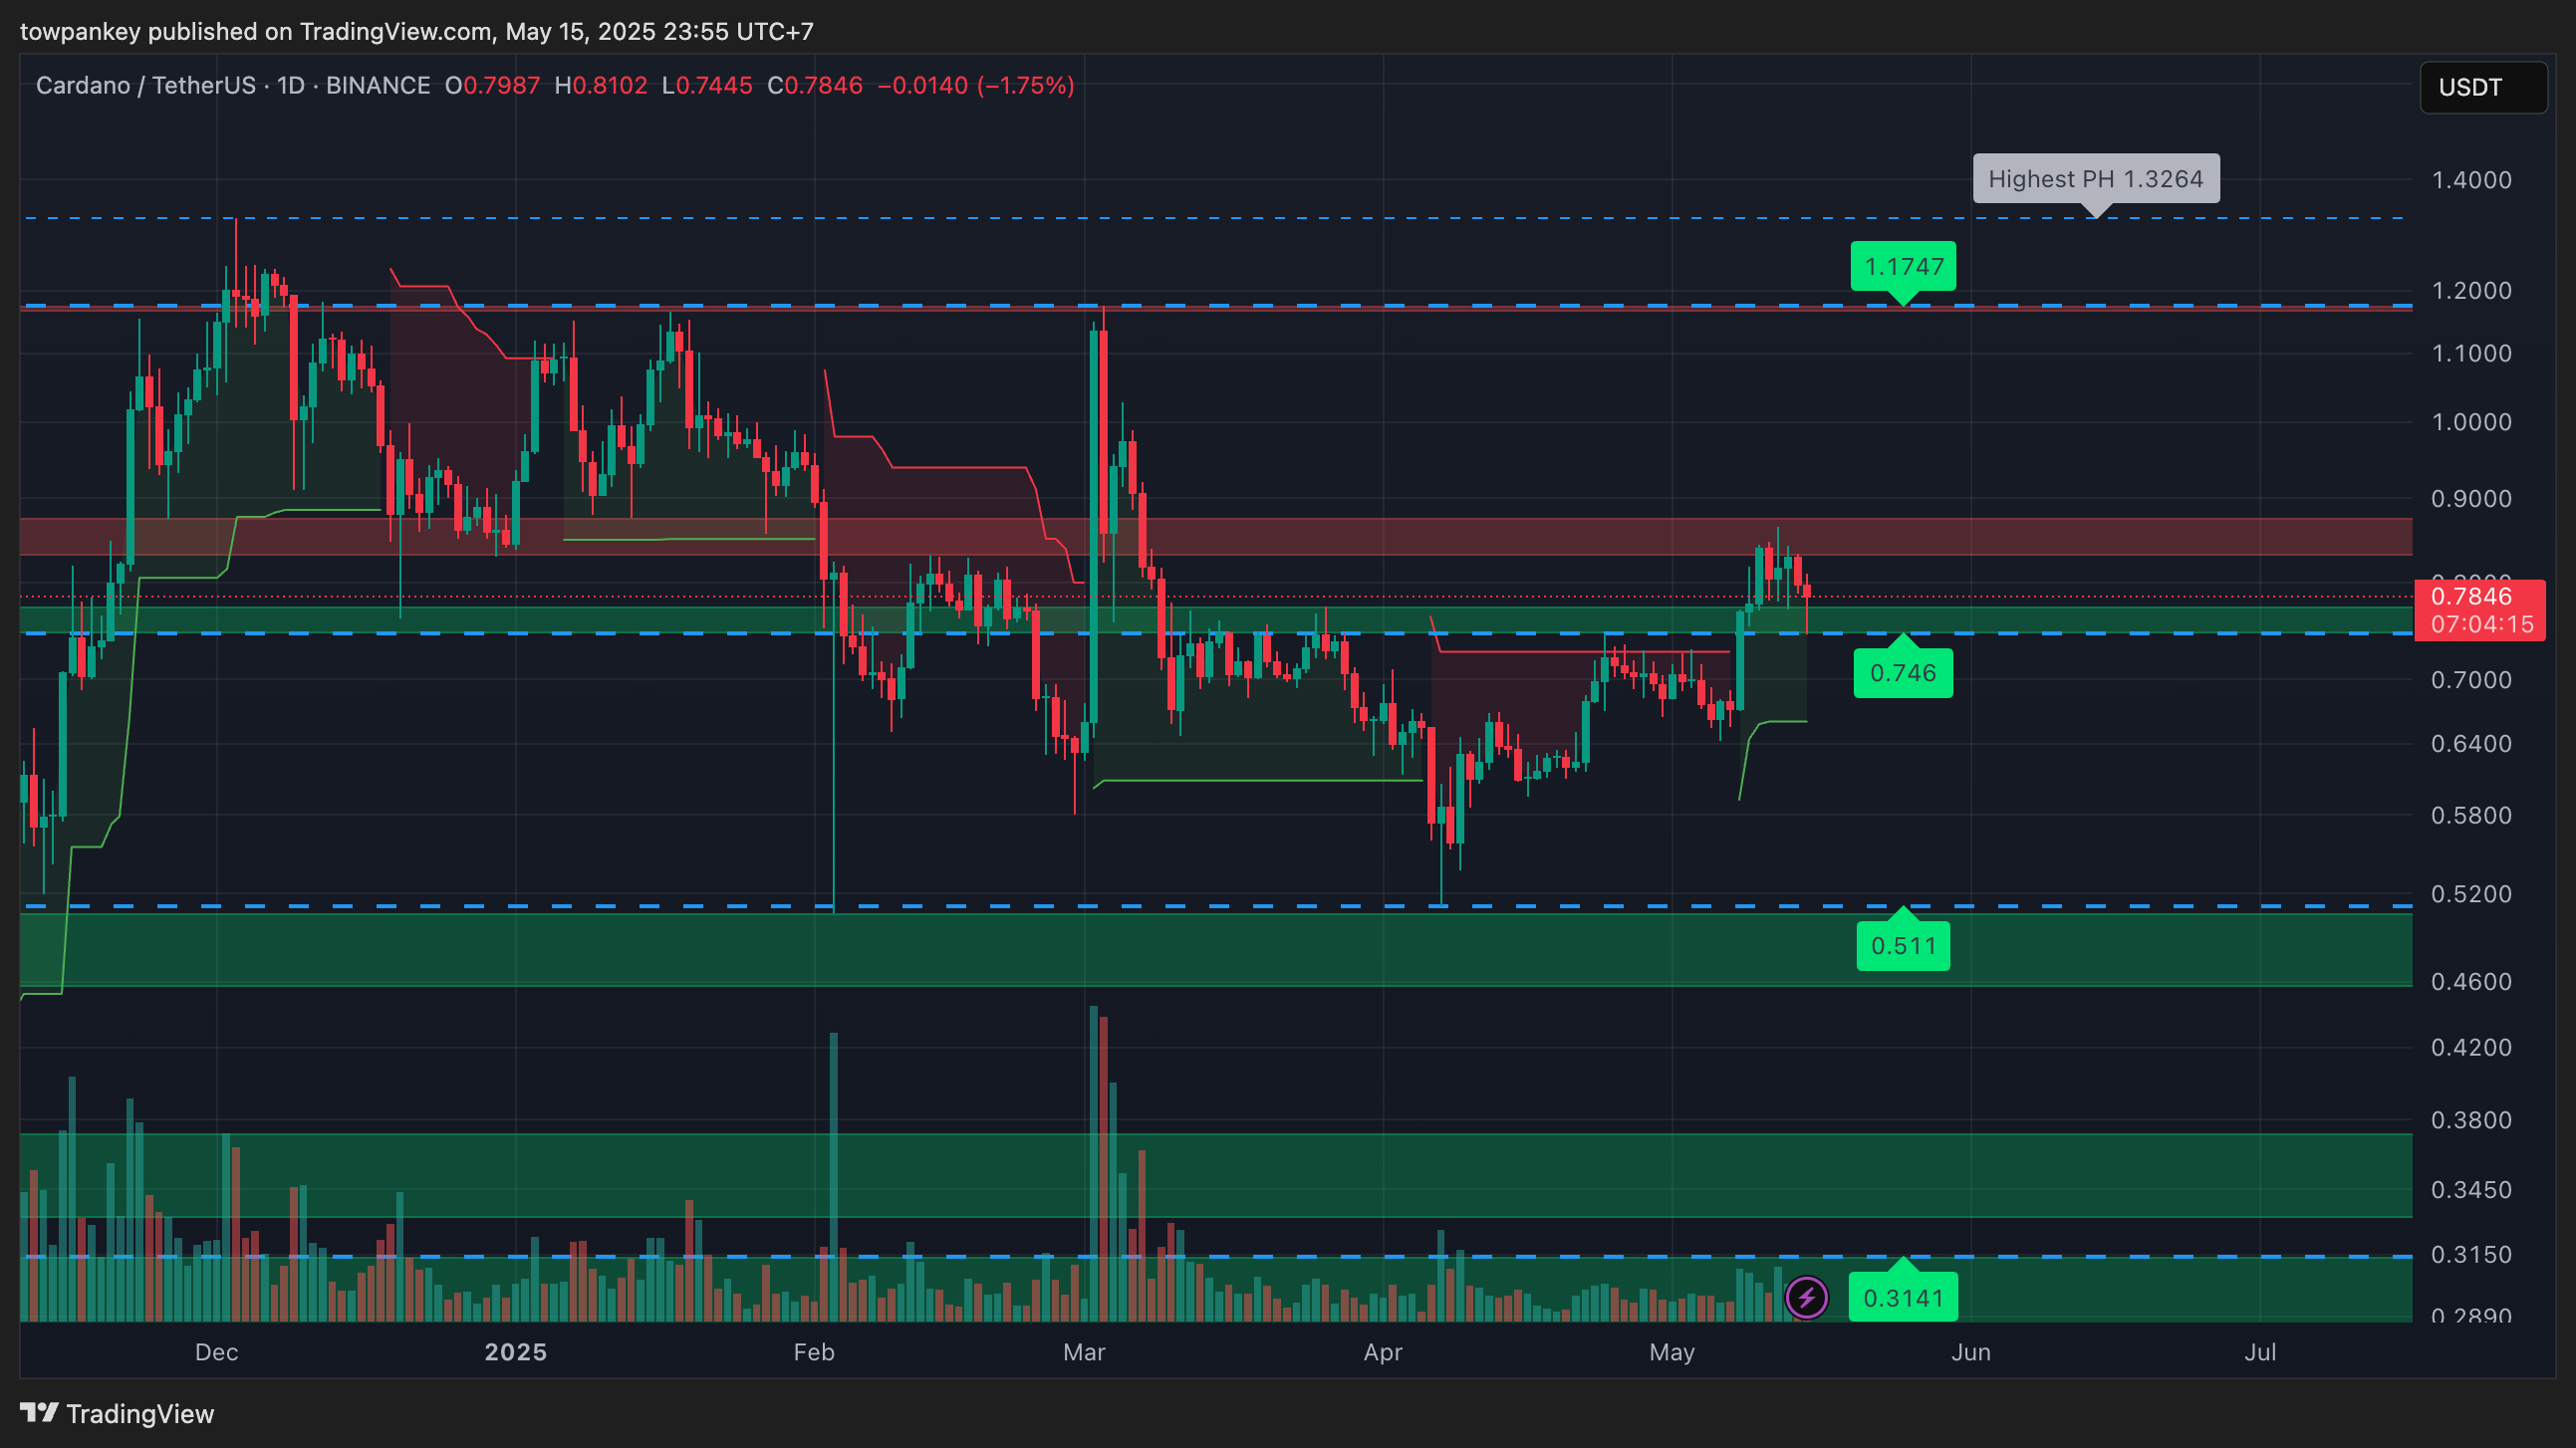

Sui Price Action Scenarios
- Bullish: If price sustains above $3.90, a rally to $4.80–$5.36 is likely
- Bearish:Rejection below $3.90 with high selling volume may cause a retrace to $2.83
- Neutral: Choppy action likely between $3.30–$3.90 if volume decreases and buyers hesitate
| DISCLAIMER: The information on this website is provided as general market commentary and does not constitute investment advice. We encourage you to do your own research before investing. |
Source: https://coincu.com/336440-altcoin-trends-solana-xrp-sui/