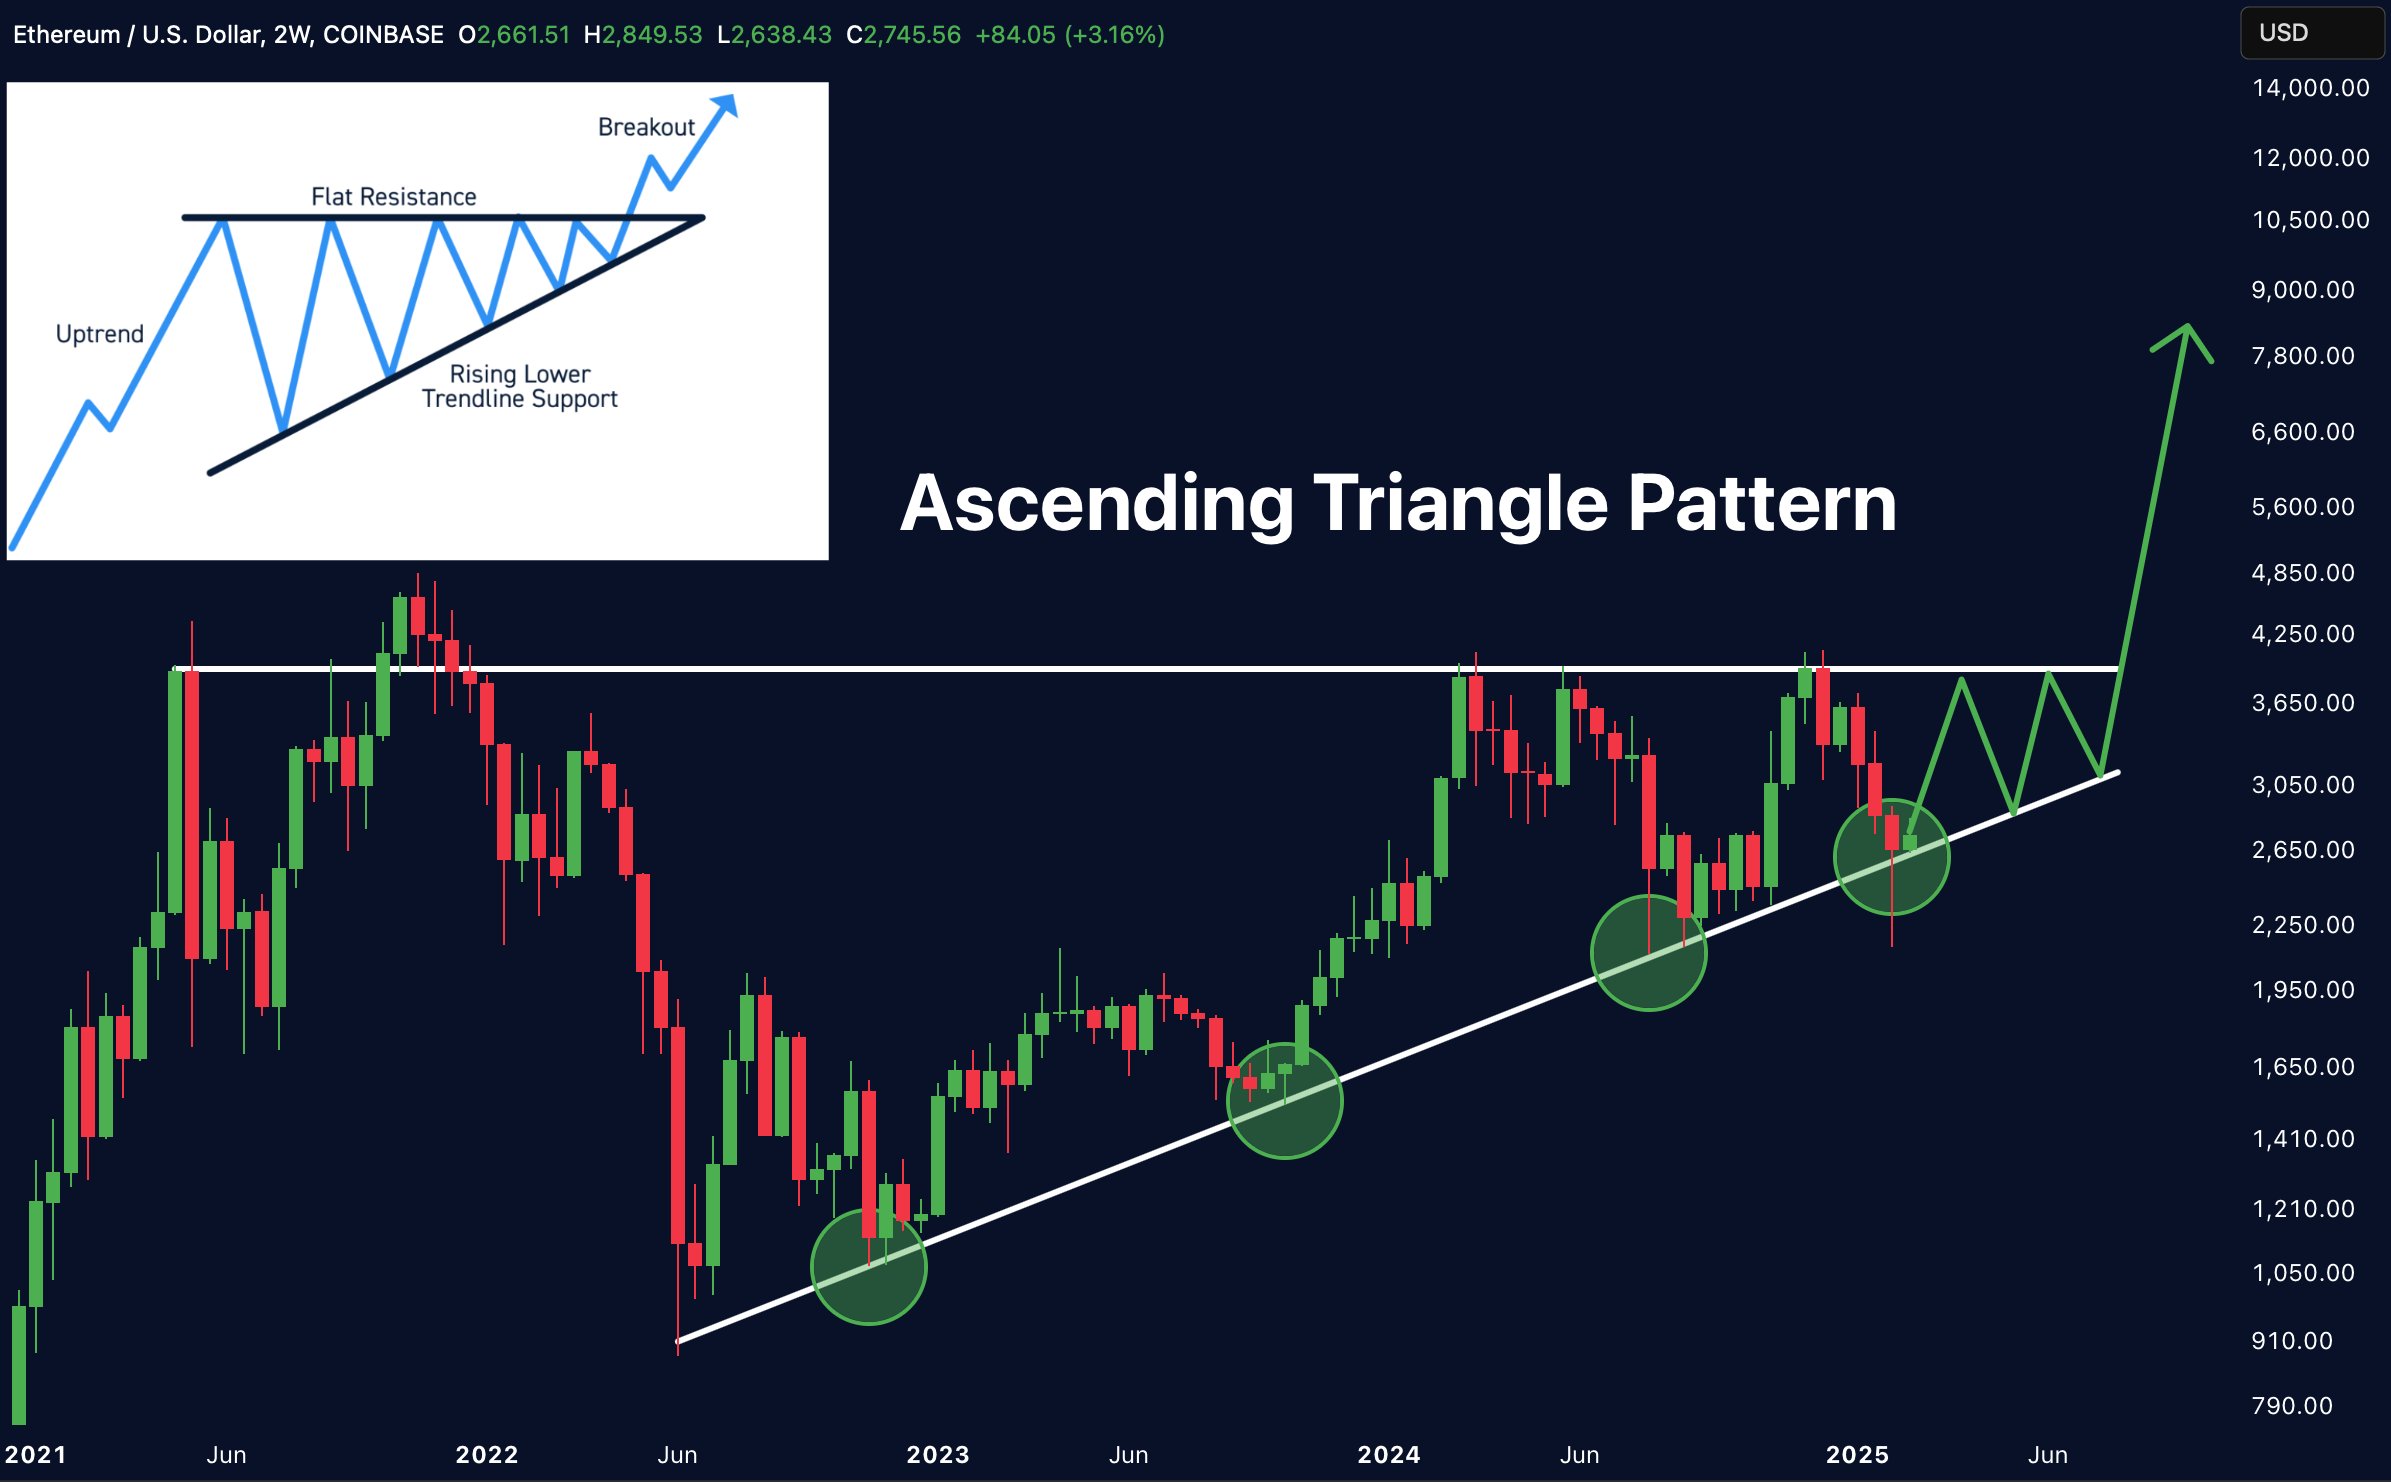
The struggling Ethereum price may be on the cusp of a monster surge after forming a multi-year ascending triangle pattern. This potential rebound may also be driven by the plummeting exchange reserves that could see Ethereum price hit $10k in the near term. Let’s explore the fundamentals and technicals that help to justify this ETH price forecast that may benefit US investors.
Ethereum Price Setup: Multi-Year Ascending Triangle With $10K Signal
Merlijn The Trader, with over 383k followers has predicted that Ethereum price was forming a multi-year ascending triangle that could lead to more gains in the long term.
He has identified this triangle pattern on the two-week chart. This pattern is made up of a series of higher lows. This pattern is also characterized by accumulation among investors.


The ascending triangle is also characterized by a horizontal resistance. In Ethereum’s case, the horizontal line is about the $4,200 level. In an ascending triangle pattern, a breakout here could ignite a parabolic Ethereum price surge in the coming months.
A breakout above $4,200 could push the value of ETH to uncharted territory, with the log scales hinting at a $10,000 target. A move above the current level of $2,688 to $10,000 would point to a 273% surge. As this article on ETH price action noted, such a move is possible in the long term since the coin has jumped from less than $50 a few years ago to over $2,000 today.
The ascending triangle is one of the most reliable continuation chart patterns in technical analysis. That’s because a strong volume-supported move above the horizontal resistance is a sign that bulls have prevailed. A good example of this is Bitcoin’s ascending triangle pattern in 2020 that triggered a strong surge during the pandemic.


Exchange Reserves Crash 11%: Bullish Fuel for Ethereum Price
The other potential catalyst for a bullish ETH price forecast is the ongoing mass exodus of ETH from exchanges. Data shows that Ethereum held on exchanges has plummeted in the last few days. They fell from 10.73 million on February 2nd to 9.54 million on February 17, an 11% drop.
A sharp decline in Ethereum balances on exchanges signals reduced supply, which, in theory, leads to more scarcity. Further, it is a sign of long-term confidence among investors since most of them are moving their coins to cold storage. In contrast, an increase in CEX balances is bearish for Ethereum price because it is a sign that investors are selling their coins.


Ethereum Price Forecast: 2 Scenarios for US Traders
Scenario 1: Breakout to $10,000
- Trigger: 4.2k breakout
- Target 1: 2024 high
- target 2: 7.5k
- moon scenario: If Ethereum enters price discovery mode, the Ethereum price could surge toward $10,000 or higher, as suggested by the chart’s logarithmic scale.
Scenario 2: Fakeout and Retest
Risk: Failure to hold above $4,200
Support Levels to Watch: 3.8k and 3.2k
Conclusion: Is Ethereum Ready for a Monster Move?
The Ethereum price is at a pivotal moment. With a multi-year ascending triangle nearing its apex and exchange reserves drying up, the setup resembles Bitcoin’s pre-2021 bull run conditions. For US investors, this is a critical time to watch ETH’s price action—whether you’re a trader eyeing a breakout or a long-term believer in Ethereum’s ecosystem.
Frequently Asked Questions (FAQs)
Technicals and fundamentals point to a potential Ethereum price bullish breakout, with the upper target at $10,000. It has formed a giant multi-year ascending triangle pattern and its exchange balances have plunged.
It is hard to predict when the bullish breakout to $10,000 will happen. But the ascending triangle has happened on the two-week chart. That is a sign that it may take months or even years for the bullish breakout to $10k to happen.
It is a sign of increased investor confidence since most of them are not selling the coin. It is also a sign of reduced supply at a time when demand is rising.
Disclaimer: The presented content may include the personal opinion of the author and is subject to market condition. Do your market research before investing in cryptocurrencies. The author or the publication does not hold any responsibility for your personal financial loss.
Source: https://coingape.com/markets/ethereum-price-analysis-signal-10k-breakout/
✓ Share: