- The TD Sequential which perfectly timed Bitcoin top on the 21st of January is now flashing a buy signal on the daily chart.
- After BTC swept liquidity below $95K, it’s headed for liquidity in levels above $98K as Whale buys at $97K.
Analysis of Bitcoin [BTC] using the TD Sequential indicator signaled a market top on the 21st of January 2025, at $103,000. Following this peak, the price of Bitcoin saw a notable decline, reinforcing the TD Sequential’s predictive reliability.
Recently, TD Sequential issued a buy signal on the daily timeframe, with Bitcoin’s price around $96,214.
This suggested the potential for a market bottom, indicating an opportune moment for investors to consider entering the market.
The presence of a buy signal after a decline indicates that the selling pressure may be exhausting, and a reversal could be imminent.

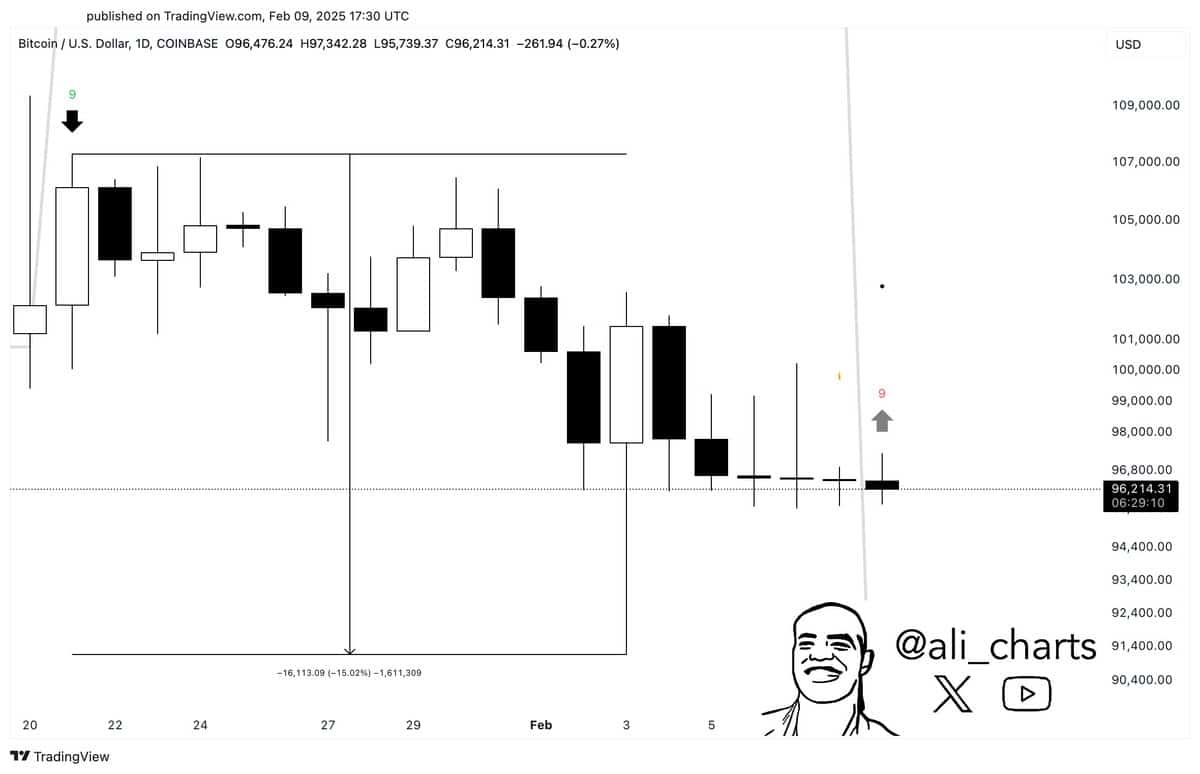
Source: Ali/X
If the buy signal does not lead to sustained buying pressure, BTC could test lower support levels, potentially around the recent lows of $94,400.
Such a drop would align with TD Sequential’s pattern of identifying pivotal points, but instead of a rally, it could precipitate further declines.
Thus, while the current buy signal presents a potentially bullish scenario for Bitcoin, investors should remain cautious.
They should consider both the possibility of a rebound towards higher levels, such as $100,000, or a continued downtrend if the signal fails to manifest into tangible buying momentum.
Dormant whale buys as BTC targets liquidity above
A dormant whale wallet “bc1qv…” withdrew 350 BTC, valued at$33.97 million, from FalconX at $97,053 per BTC. The substantial purchase by a major player could indicate potential upward momentum.
However, if the market sentiment does not align with the whale’s buying strategy, this could potentially push prices down if others decide to cash out, fearing a top.
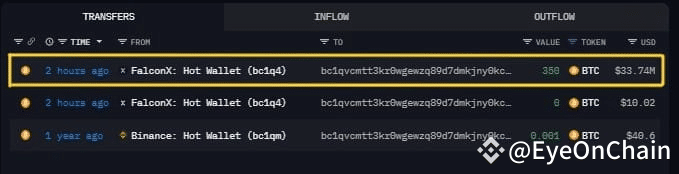

Source: EyeOnChain/X
Following a sweep of liquidity below $95K, BTC appears poised to test higher levels, particularly around $98K. This move supports a potential continuation if BTC can maintain support above these critical liquidity thresholds.
Typically, overcoming such zones can catalyze further buying interest, potentially pushing prices upwards. Conversely, if BTC fails to breach the $98K liquidity zone, it could indicate insufficient buying pressure, possibly leading to another retracement.
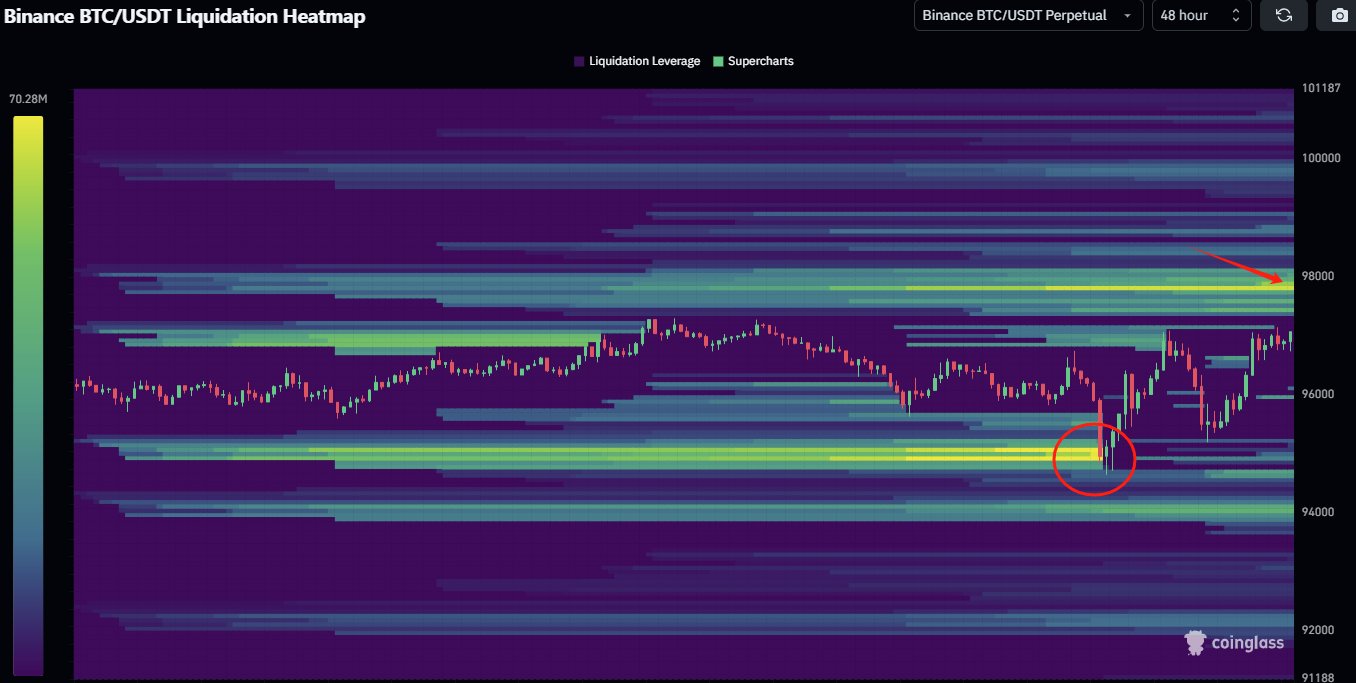

Source: Coinglass
Lastly, according to analyst Benjamin Cowen on X, the Total On-Chain Risk indicator suggested that Bitcoin’s peak may not have been reached.
The metric currently shows levels that are not typical of a market top. This implies a potential for a further rally.
Read Bitcoin’s [BTC] Price Prediction 2025–2026
Conversely, if the risk indicator begins to show values associated with previous market tops, it could signal that the current rally might be nearing its end.
This scenario would require close monitoring of any shifts in on-chain activity that could precede a price correction.
Source: https://ambcrypto.com/bitcoin-can-a-33-9m-whale-purchase-push-btc-past-100k/