In the new crypto week, Bitcoin is projecting strong possibilities of a bullish comeback. With an intraday gain of 1.38%, Bitcoin is close to crossing above the $98,000 mark.
As the bullish comeback marks the end of four consecutive doji candles, Bitcoin is aiming to reclaim the $100,000 mark this week. Will this reclamation lead to a new all-time high for Bitcoin? Let’s find out.
Bitcoin Price Analysis: A Bullish Halt in the Negative Cycle
In the daily chart, the BTC price trend showcases an early halt in a negative cycle. The negative cycle was between a consolidation range extending from the $90,000 psychological mark to the $107,000 upper ceiling zone.
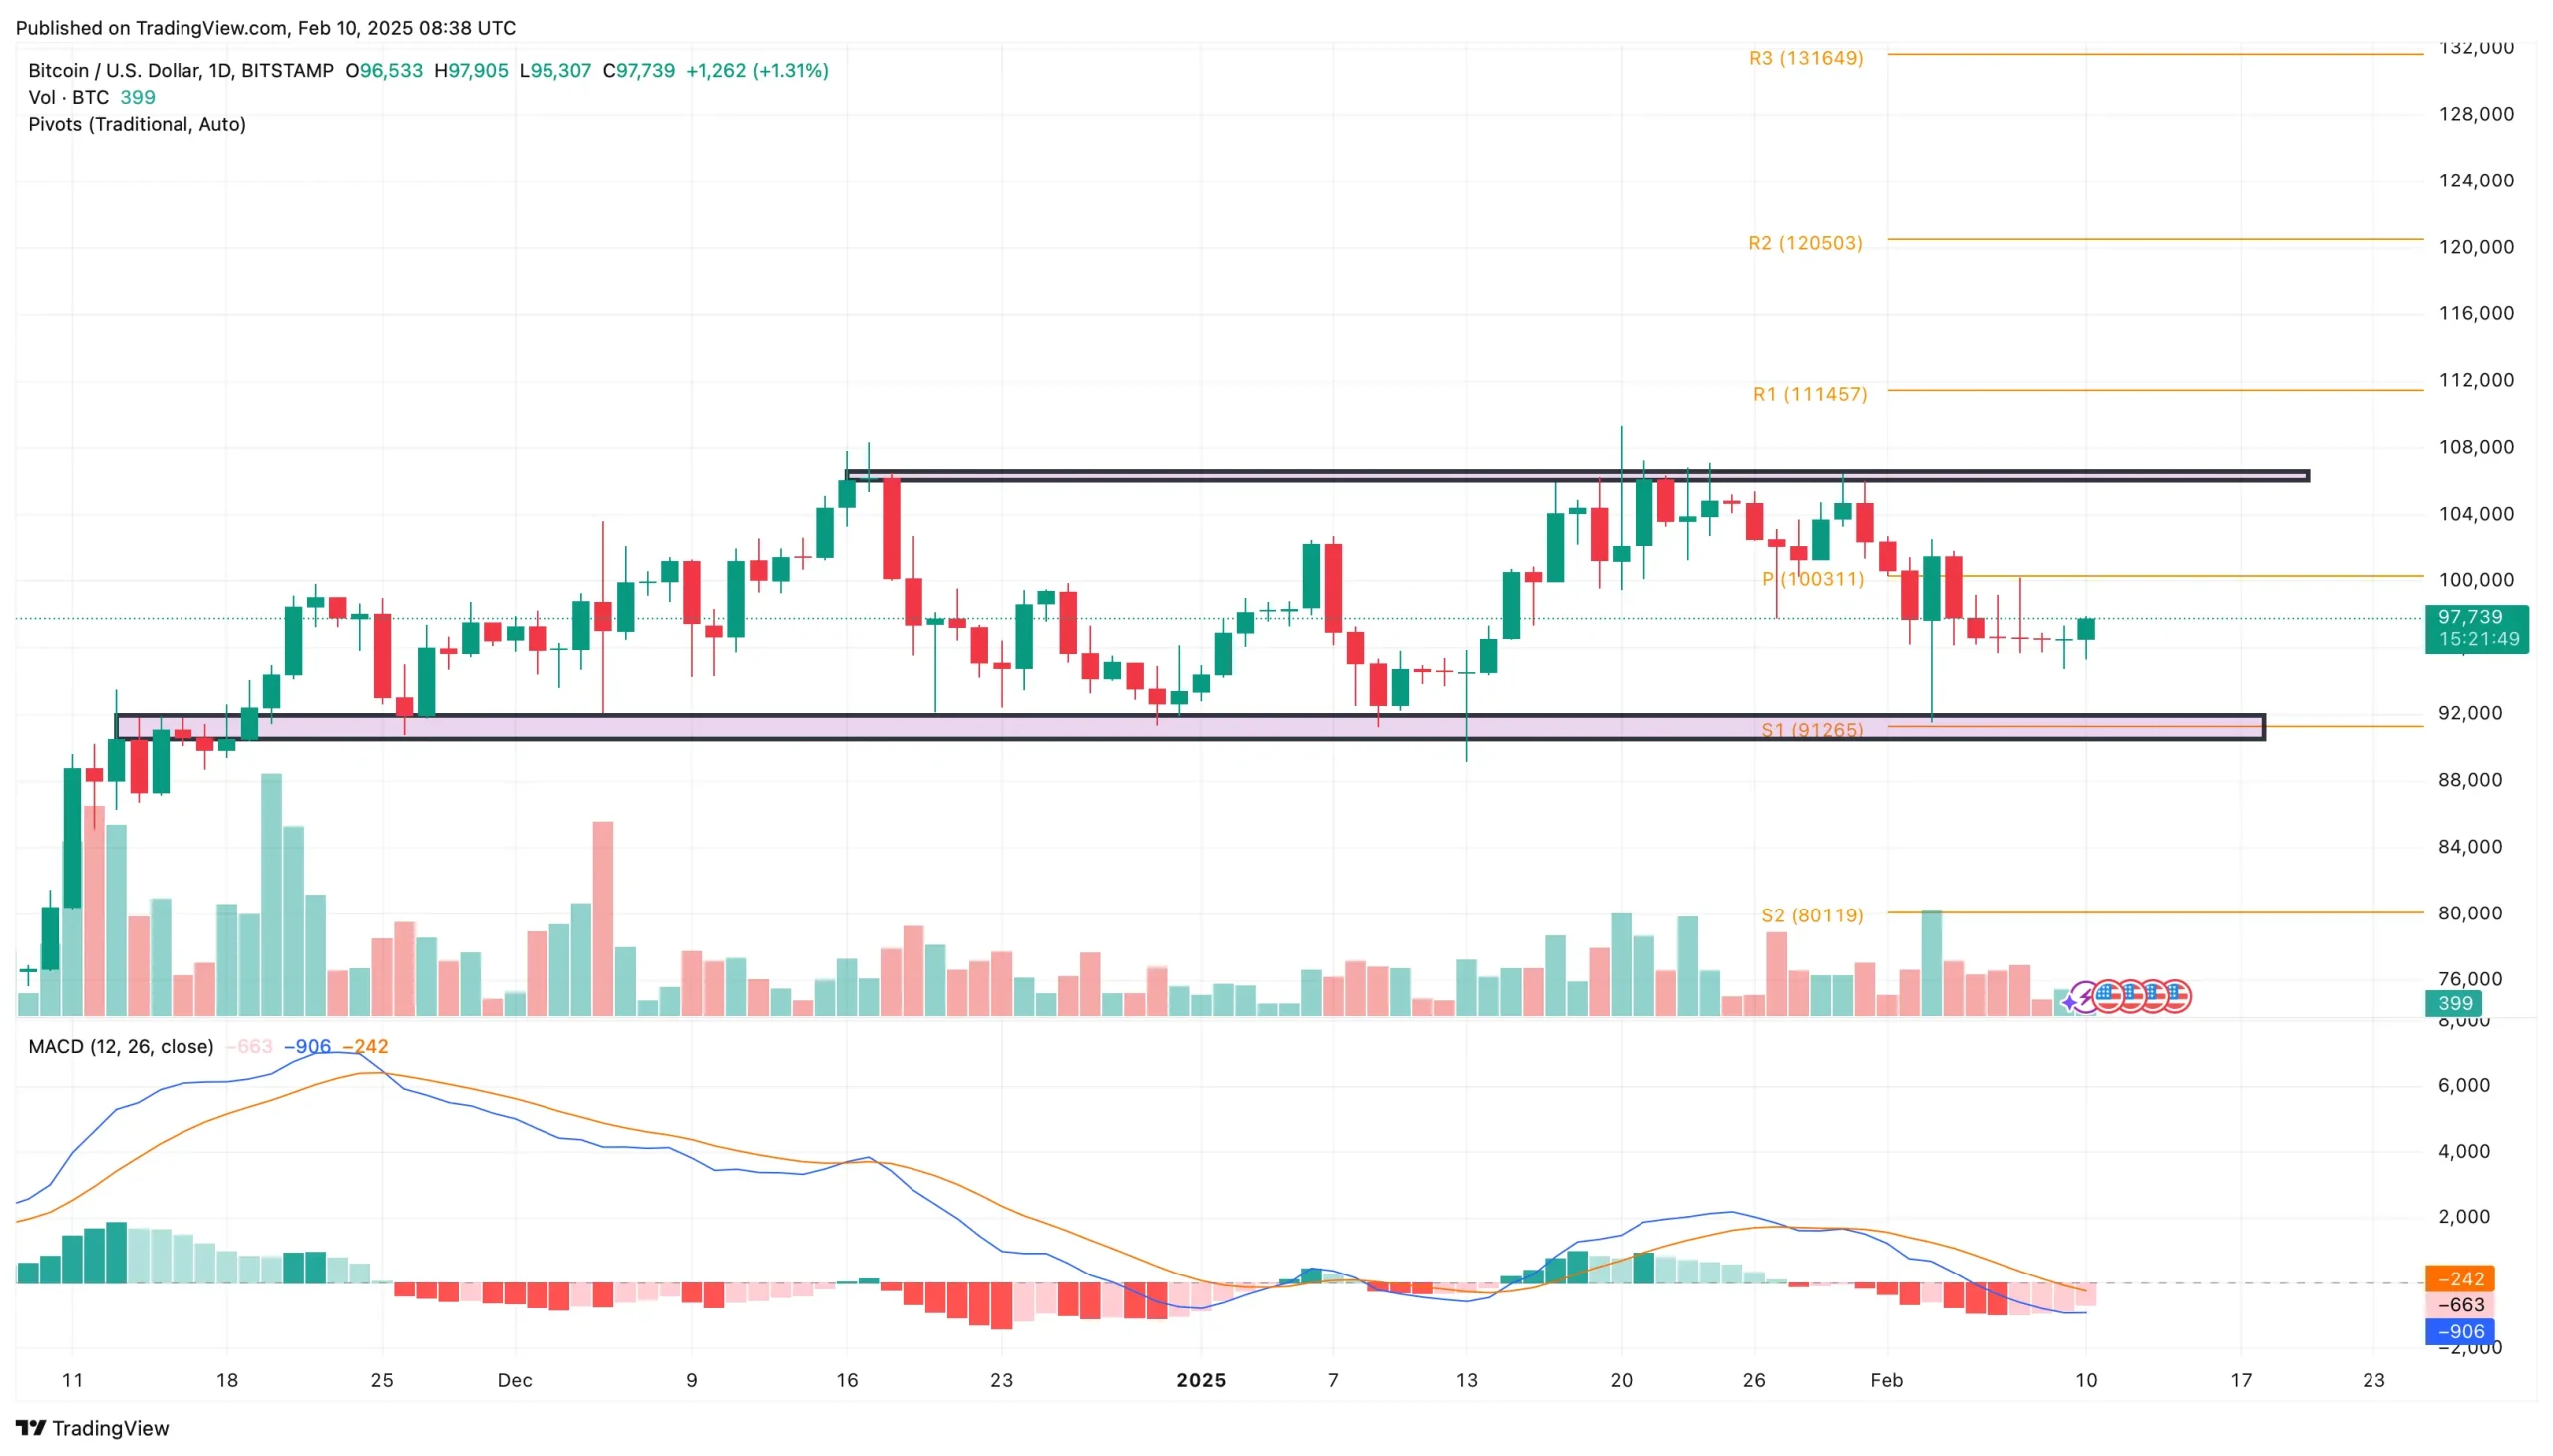

The sudden halt near the $95,000 psychological mark in Bitcoin marks a strong bullish support. With the intraday recovery, Bitcoin is aiming to challenge the center pivot level near the $100,000 psychological resistance.
Amid the recovery chances, the MACD momentum indicator is hinting at a potential positive crossover. This comes with a sharp decline in its bearish histogram.
As for the pivot levels, a bullish breakout of the center pivot level will likely challenge the overhead ceiling before testing the $111,457 R1 pivot resistance level. This will mark a new all-time high and also put the $120,000 mark on the bullish potential.
On the flip side, the $90,000 support level will likely remain strong. However, a bearish closing under this will likely test the S2 pivot support level near the $80,000 mark.
Institutional Support: Mixed Signals for Bitcoin ETFs
While Bitcoin price trends hint at a potential recovery, the institutional support for Bitcoin remains uncertain. Last week, between Feb. 3 and Feb. 7, the U.S. spot Bitcoin ETF recorded an inflow of $203.8 million.


The daily inflow fluctuated between an outflow of $234 million to an inflow of $340 million. The institutional support for Bitcoin is projecting an uncertain trend.
However, the institutional support for Ethereum maintains a positive trend. Hence, stability in U.S. regulations after the ongoing tariff war will likely boost the demand for Bitcoin ETFs.
Technical Analysis: Falling Wedge Breakout Signals Bullish Momentum
Supporting the chances of a bullish recovery, Carl Moon, Crypto Analyst, highlights the possibility of a bullish comeback with the breakout of a falling wedge pattern. The BTC price trend in the hourly chart is on the verge of crossing the local resistance trendline to reach the previous resistance level of $106,500.


This marks an upside potential of 9.02% upon breakout.
Crypto Analyst Signals Buying Opportunity for Bitcoin
In a recent X post, Ali Martinez, a crypto analyst, has highlighted a potential buying opportunity for Bitcoin based on the TD Sequential indicator and the January 21 top. The indicator is triggering a buy signal.


The bullish signal arises after days of pullback and consolidation. Amid such conditions, the buying signal is hinting at a potential turnaround in Bitcoin.
Source: https://www.cryptonewsz.com/bitcoin-targets-100k-can-bulls-push-btc-to-a-new-ath/