The ‘Thinking Ahead’ report from blockchain intelligence firm Glassnode reveals a striking resemblance between Bitcoin’s current bull market and the 2015–2018 cycle—a pattern that could hint at what’s to come. While the token’s price remains on an uptrend, this rally looks different from previous parabolic runs.
According to the report, a crucial metric, Realized Cap, which measures the total value of Bitcoin based on the price of each coin’s last movement, has only expanded 2.1 times from the cycle low. That’s far below the explosive 5.7x growth of the previous cycle yet eerily aligned with the 2015–2018 trend at this stage.
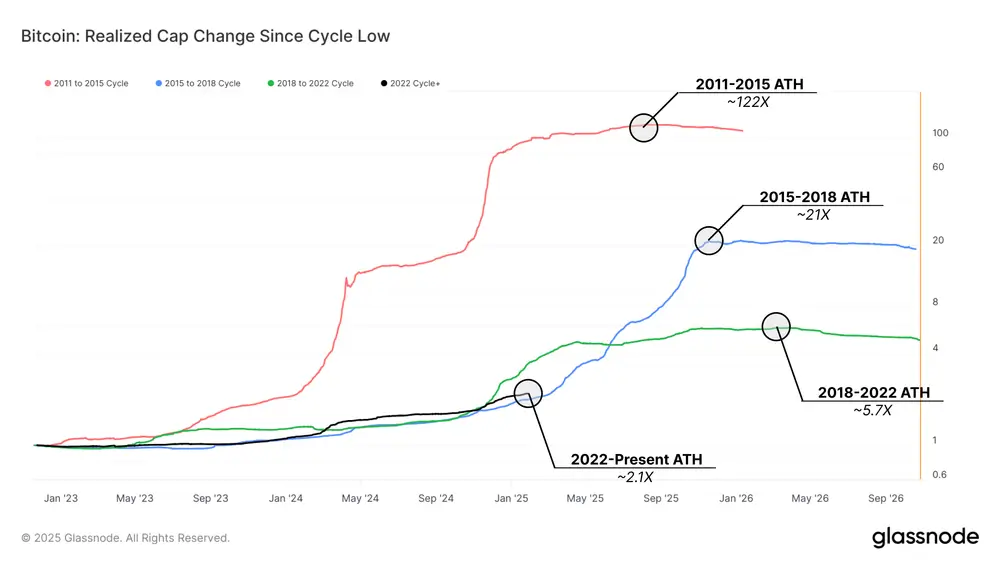
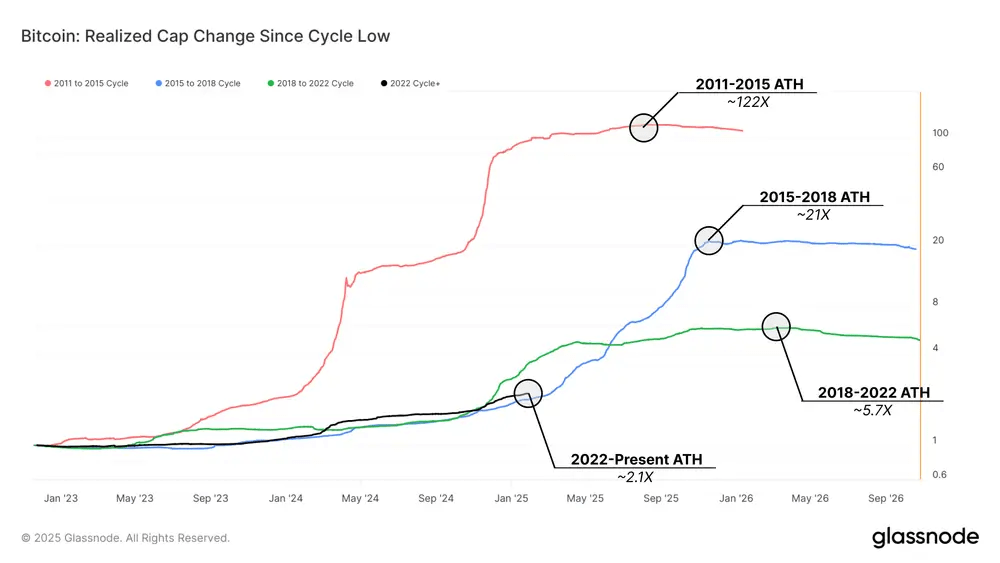
This means that Bitcoin’s bull market is still progressing, but its growth is more controlled, possibly due to a maturing market with institutional investors playing a larger role. Another hot topic in the crypto space is the steady decline in Bitcoin balances on centralized exchanges, which have dropped to 2.7 million BTC from 3.1 million BTC in mid-2024.
On the surface, this suggests a looming supply shock, where fewer available coins could drive prices higher. But Glassnode offers a different perspective—this shift isn’t due to retail investors hoarding BTC tokens but rather a migration of assets into Exchange-Traded Fund (ETF) wallets, with custodians like Coinbase managing these large-scale holdings.
This scenario hints that while fewer Bitcoin cryptocurrencies are sitting on exchanges, they are not necessarily being taken out of circulation, reducing the chances of an immediate supply squeeze. Another crucial insight from the report is the capital rotation from long-term holders to new investors. In every major Bitcoin cycle, there are phases where early investors sell their holdings to newer participants, creating waves of redistribution.
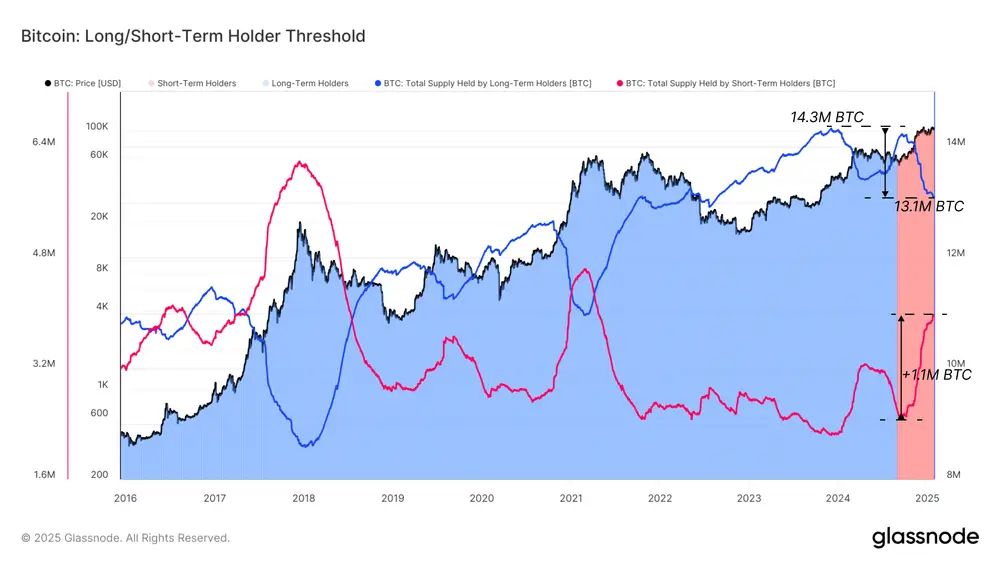
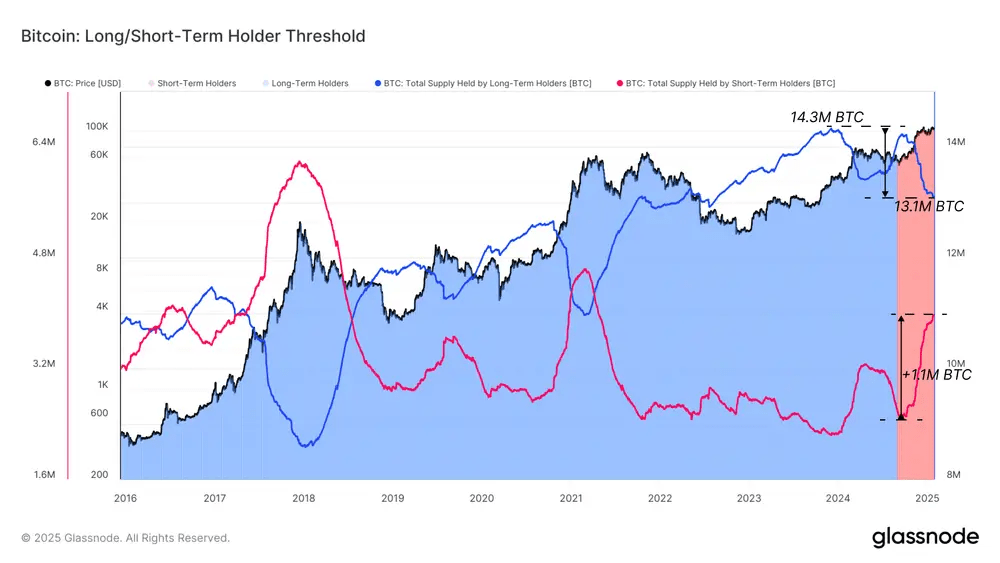
Glassnode finds that the current market is experiencing a similar transition to that seen in the late 2017 and early 2021 bull runs. When this happens, markets often experience a short-term slowdown or consolidation as demand tapers off.
The report warns that the BTC cryptocurrency could enter a phase of demand exhaustion, where fewer buyers are willing to pay higher prices, leading to sideways movement or minor corrections. But here’s the kicker: if history stays true to form, Bitcoin’s story isn’t over yet—and the next chapter could be its most explosive one yet.
The Inevitable Cycle: What Comes Next?
The charts provide critical insights into the BTC token’s current cycle, with higher and shorter timeframes aligning to suggest continued bullish momentum. On the higher timeframe, the first chart highlights a cup-and-handle pattern, a reliable bullish structure, alongside a Golden Cross, where the 50-week moving average crosses above the 200-week.


These signals point to sustained long-term upside potential. At press time, the BTC cryptocurrency has already broken past the 1.618 Fibonacci extension at $102,000. The next key resistance level on the higher timeframe lies at the 2 Fibonacci level, around $122K, a 77% gain from current levels. As the cycle matures, a possible bull target of $136,000 and $155,000 remains achievable.
The shorter timeframe analysis complements this view, showing consolidation just below a resistance zone at $106,000, aligning with the 0.618 Fibonacci level. Strong buyer interest is evident in the accumulation zone between $100,000 and $103,000, while an ascending trendline indicates higher lows.
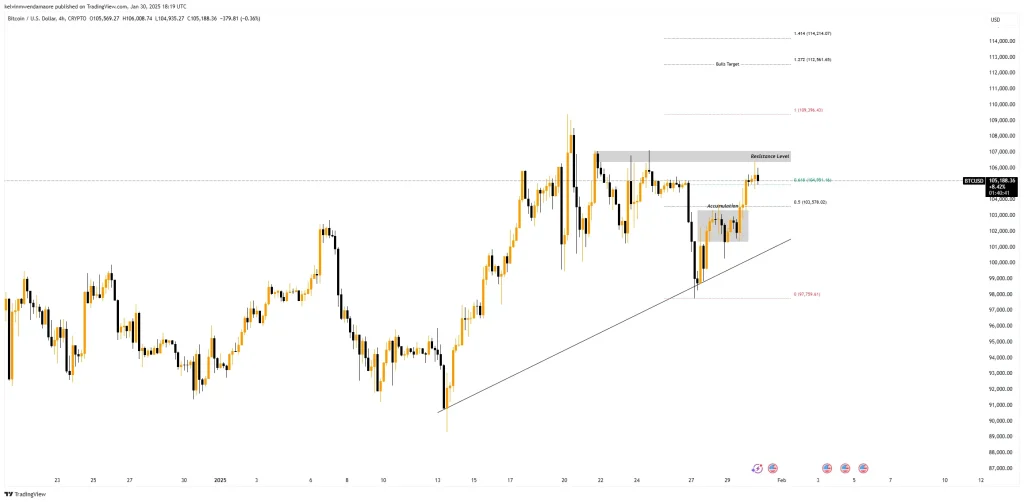

A decisive break above $106,000 could catalyze the token’s next move, propelling it toward $112,000 and supporting the broader bullish trend observed in the higher timeframe. This alignment suggests the bull market still has room to run in the months ahead.
Also Read: Ethereum Price 50-Day Correction Nearing End as Active Addresses Spike 37%
Source: https://www.cryptonewsz.com/bitcoin-bull-market-echoes-2015-2018-cycle/