- OFFICIAL TRUMP, Raydium, and Flare registered the week’s biggest gains
- Pudgy Penguin, Fantom, and Floki Inu emerged as the week’s biggest losers
The cryptocurrency market delivered another eventful week of trading, marked by dramatic debuts and significant price swings across both established and emerging tokens. While some assets demonstrated remarkable resilience and growth, others faced significant selling pressure, highlighting the market’s volatility.
Biggest winners
OFFICIAL TRUMP
OFFICIAL TRUMP delivered a jaw-dropping performance on its debut trading day, skyrocketing by over 626% to become this week’s standout performer. The token, launched on 18 January, saw its price surge from around $10 to hit highs above $55, demonstrating remarkable momentum and pushing its market capitalization past $11 billion.
The price action revealed aggressive buying pressure throughout the trading session, with each pullback met by fresh waves of demand. Notable consolidation phases around the $30-mark served as launching pads for further advances, while volume spikes accompanied key breakout points. At the time of writing, its volume was over $13 billion.
This explosive growth has catapulted TRUMP to become one of the largest memecoins by market cap within just 24 hours of launch. Its sharp vertical moves and rapid capitalization growth hinted at the potential for significant price swings in either direction. Especially as the market digests this remarkable debut.
Raydium (RAY)
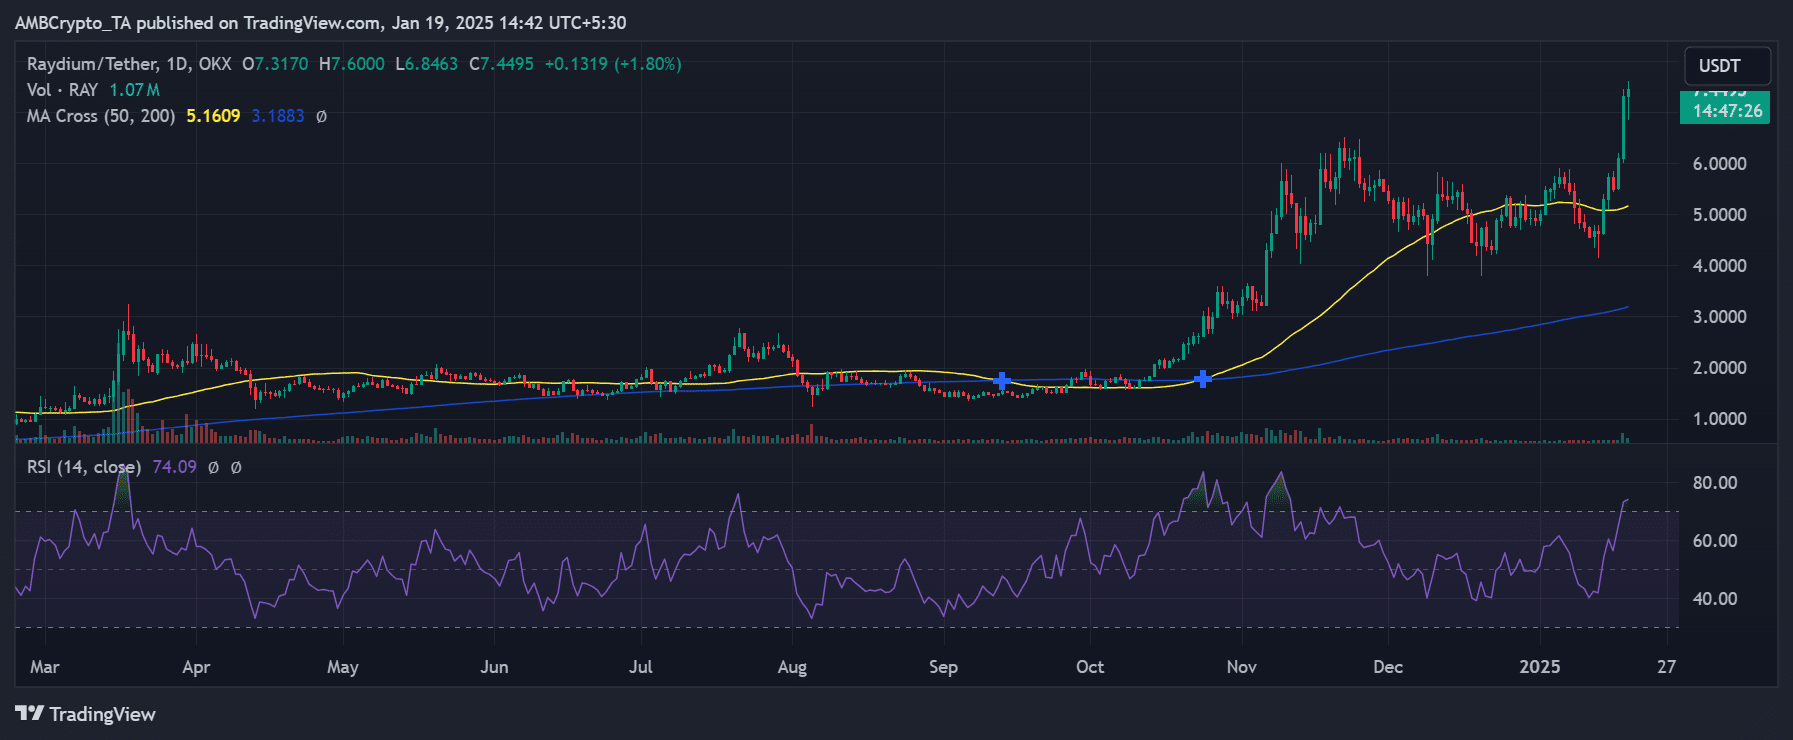
Meanwhile, Raydium (RAY) has established itself as another standout performer this week, climbing from $4.50 to $7.44 following impressive gains of 67%. The token’s price action saw a methodical uptick, rather than the erratic jumps often seen in crypto markets.
The weekly chart revealed a clear three-phase advance – An initial consolidation around $4.50, followed by a steady climb to $5.70, and finally, a powerful breakout pushing the price above $7. The trading volume, sitting at 1.07M RAY, has remained consistently strong throughout the advance, validating this upward momentum.


Source: TradingView
From a technical perspective, RAY maintained a robust position above both its 50-day (5.1609) and 200-day (3.1883) moving averages, confirming the long-term bullish structure. The RSI at 74.09 indicated overbought conditions, though strong uptrends can sustain elevated RSI levels for extended periods.
The price behavior around the $6 resistance level seemed to be particularly noteworthy, which initially acted as a ceiling before it was decisively broken. The subsequent price action highlighted strong buyer conviction too, with pullbacks finding support at progressively higher levels.
While the momentum has been bullish, traders should note the overbought RSI readings and watch for potential consolidation around press time levels. The $6-zone, previously resistance, should now provide support for any retracements. Volume patterns hinted at genuine institutional interest rather than retail-driven speculation too, potentially supporting sustained price appreciation.
Flare (FLR)
Similarly, Flare (FLR) demonstrated impressive strength this week, climbing from $0.025 to $0.029 – Marking solid 17% gains. The token’s price action demonstrated a well-structured upward movement characterized by higher lows and steady buying pressure.
The week began with a brief dip to $0.023, creating a spring before the upward move. FLR established a clear uptrend from this low, with each consolidation phase serving as a launch pad for the next leg up. Particularly notable was the surge on 17 January, one that pushed the price to $0.033, though some profit-taking followed.
Despite the late-week pullback to $0.029, the overall trend remains constructive, with dips finding consistent support at progressively higher levels. The measured pace of the advance, coupled with increasing volume during upward moves, alluded to genuine accumulation rather than speculative activity. This can potentially set the stage for further gains.
Biggest losers
Pudgy Penguin (PENGU)
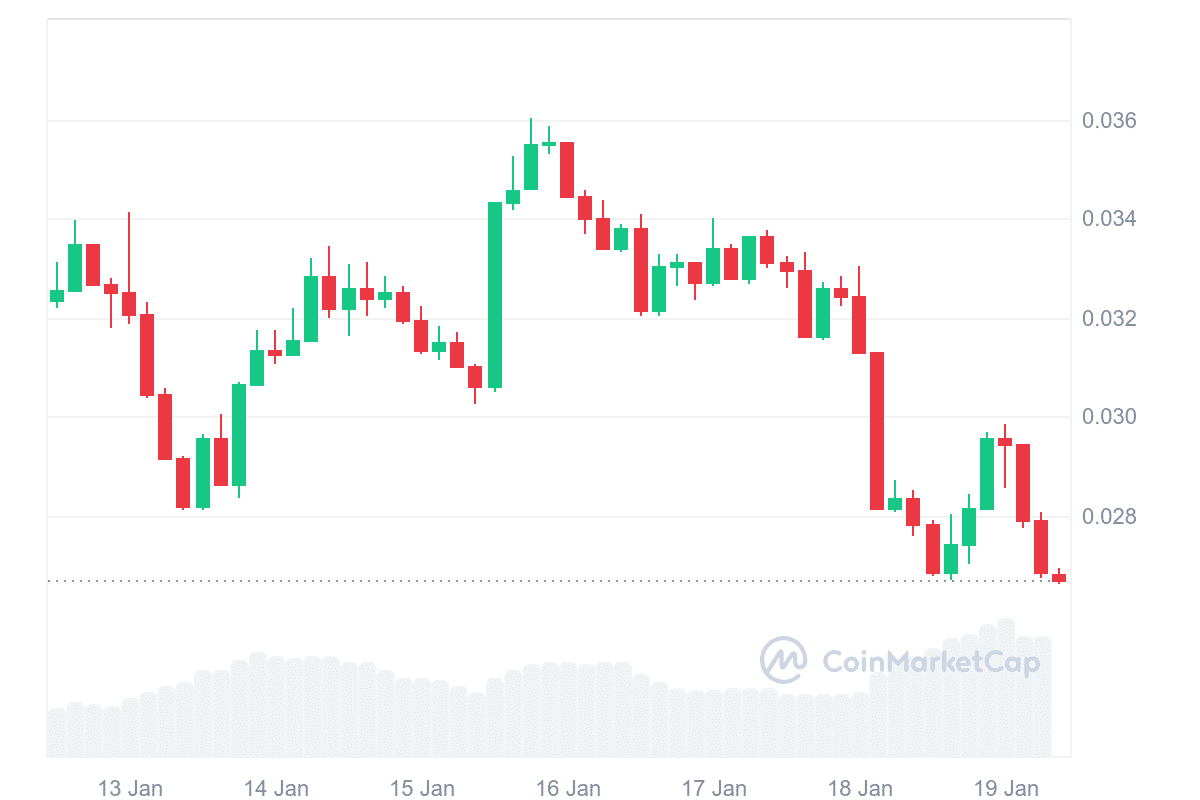
On the opposite end of the spectrum, PENGU struggled to maintain support, sliding from $0.033 to $0.026. This marked a steep 17% decline, placing it among this week’s biggest losers. The token’s price action tells a story of waning buyer confidence and increasing selling pressure.
The weekly chart mapped out a clear deterioration in price structure, starting with an early-week struggle around $0.033 before a brief spike to $0.036 on 16 January. This rally proved short-lived as sellers swiftly took control, pushing the price down to its press time levels of around $0.026, with today’s trading showing a concerning 9.97% drop.


Source: CoinMarketCap
Technical indicators painted a decisively bearish picture too. The RSI plunged to 40.21, while the MACD highlighted growing negative momentum with readings at -0.001036, suggesting the downward pressure might not be over yet. Trading volume at 2.8 billion PENGU indicated significant selling activity, particularly during the recent downturn.
Most concerning was the lack of meaningful support levels following the break below $0.030. Each attempted bounce has been met with more selling pressure, forming a pattern of lower highs and lower lows. The token’s failure to hold support at $0.028 could signal further weakness ahead.
While oversold conditions might typically allude to a potential bounce, the combination of declining volume during relief rallies and increasing volume during sell-offs indicates a lack of confident dip buyers. Traders should watch the $0.025-level closely, as a break below could accelerate the selling pressure.
Fantom (FTM)
Similarly, Fantom (FTM) experienced significant turbulence, dropping from $0.70 to $0.65, recording a 13% decline. The token’s price action shows a Jekyll and Hyde pattern, with an initial surge to $0.825 on 16 January before sellers took control.
The early week saw FTM consolidating around $0.70 before staging an impressive rally that pushed prices up by nearly 18%. However, this momentum proved unsustainable as selling pressure intensified, leading to a sharp reversal. The decline accelerated notably on 18 January, with the token breaking through multiple support levels.
The recent price behavior is most concerning, showing consecutive red candles with increasing selling volume. The failure to hold support at $0.70 suggests weakening buyer interest, while the current price action around $0.65 shows little sign of stabilizing. Without a significant shift in momentum, FTM could test lower support levels in the coming sessions.
Floki Inu (FLOKI)
FLOKI’s price action this week reflects mounting selling pressure, dropping from $0.0316 to $0.0315, recording a 4% decline. However, the week’s journey was anything but straightforward.
The token started with a sharp dip to $0.0315 on 14th January before staging a recovery that culminated in a push to $0.0319 by 18 January. This rally, while impressive, proved unsustainable as sellers emerged at these elevated levels. The subsequent reversal erased the mid-week gains, pushing prices back toward weekly lows.
The chart reveals a pattern of failed breakout attempts, with each push higher met by increasing selling volume. The current price action around $0.0315 suggests continued weakness, though the measured pace of the decline indicates orderly selling rather than panic.
Source: https://ambcrypto.com/crypto-markets-weekly-winners-and-losers-trump-ray-pengu-ftm/