- On the price charts, LINK broke out of a bullish flag pattern after weeks of consolidation
- Whales stepped up their activity, purchasing a significant portion of LINK
In the last 24 hours, LINK saw a notable price hike of 1.65%, extending its market gains for the past week to 22.35%. What this means is that there may be potential for further price movement on the charts.
In fact, market sentiment and price action indicated that LINK could record double-digit gains soon, particularly if the prevailing bullish trend persists.
Double-digit gains to push LINK to $50?
According to popular crypto analyst Ali, LINK has taken its first step towards a major bullish move. This, after the altcoin breached a key resistance level of the bullish pattern it was traded within.
The pattern in play is known as a bullish flag, where the price consolidates within a defined support and resistance zone after a major upswing. This sets the stage for more upside, something that is usually confirmed once the resistance level is broken – Which LINK has done already.


Source: TradingView
The chart, which included Fibonacci retracement levels, highlighted a phase where the price may register slight pullbacks before continuing its upward trajectory. The potential target from this zone is $58.64, nearly three times its press time value of $22.906.
According to AMBCrypto’s analysis, whale accumulation of LINK will play a significant role in driving this price push on the charts.
Whale purchases could drive LINK’s surge
IntoTheBlock’s data also highlighted a major hike in large investor activity on LINK. These large investors, typically holding 0.1% to 1% of the total supply, have been playing a key role in LINK’s recent price action.
In the last 24 hours alone, the number of large transactions involving LINK spiked to 593, with a total volume of 10.3 million LINK valued at $258.51 million.


Source: IntoTheBlock
Such large transactions, when followed by a price hike and a bullish breakout on the chart, imply that buying activity has dominated the market during this period.
There has also been a noticeable hike in the number of active and new addresses, indicating heightened market activity which has likely contributed to the latest price jump.
In fact, data from the last 24 hours revealed that the number of addresses involved in LINK transactions rose to 5,810, while new addresses onboarded climbed by 1,860.


Source: IntoTheBlock
On a weekly basis, these numbers represented a 39.02% and 40.42% hike, respectively – Highlighting strong bullish sentiment among market participants.
If these trends continue, the ongoing uptick in large transactions, new address adoption, and active address engagement could further support LINK’s momentum.
Is a supply squeeze on the horizon?
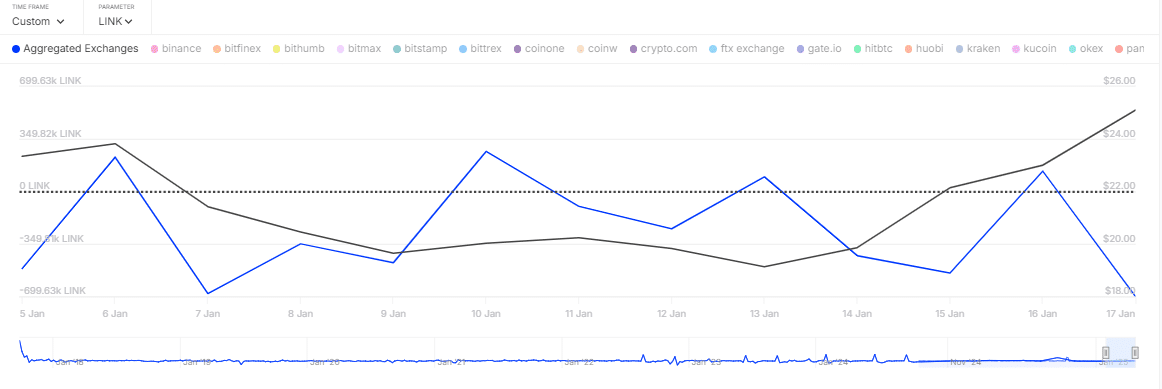
Finally, on-chain data revealed high outflows of LINK from cryptocurrency exchanges, outpacing inflows into the market.
This was identified using the Aggregated Exchange Netflow, which tracks the deposits and withdrawals of assets across various crypto exchanges. At press time, the netflows revealed a negative reading of 149,670 LINK.


Source: IntoTheBlock
Such a large withdrawal means that market participants are capitalizing on the prevailing bullish trend, preferring to hold their LINK outside of exchanges for long-term storage. This can fuel a supply squeeze for the altcoin.
If this trend continues and the netflow remains negative, it could signal an extended price surge for LINK, potentially leading to a supply squeeze.
Source: https://ambcrypto.com/mapping-links-road-to-58-heres-how-large-holders-can-spur-this-rally/