- Ethereum faces heightened volatility following the latest CPI data, sparking market speculation
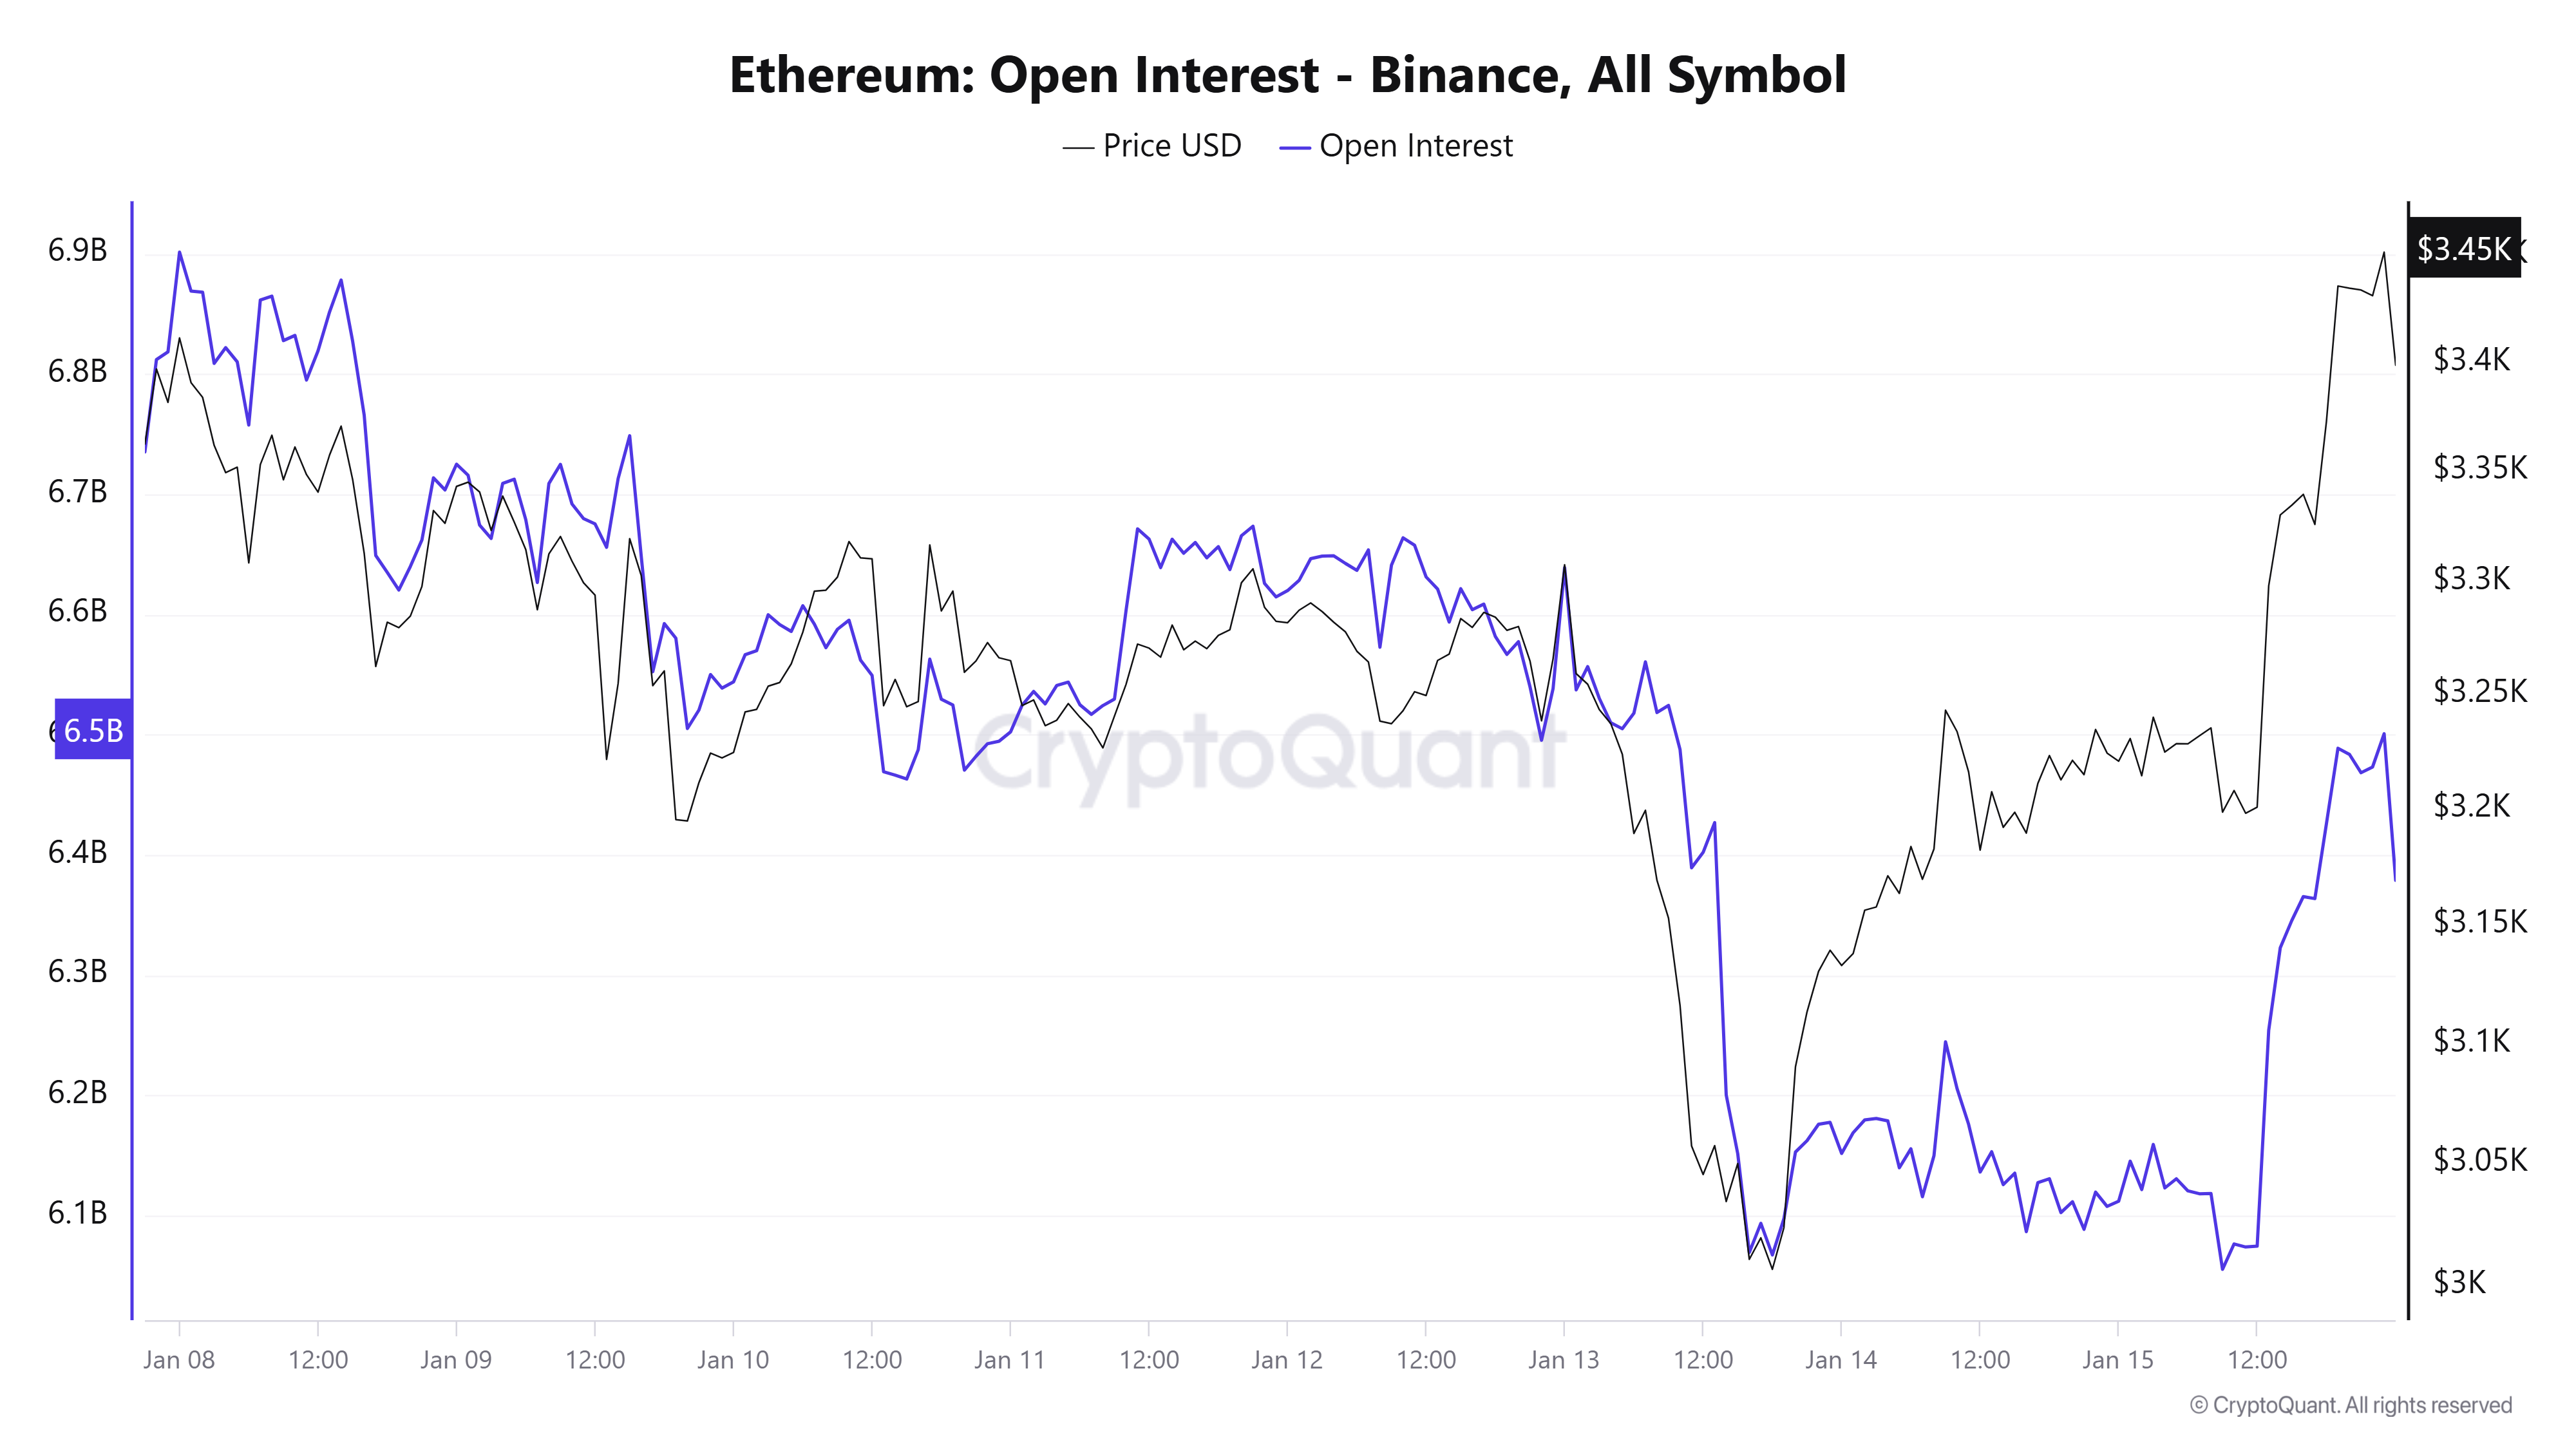
- In light of the CPI data announcement, ETH Open Interest spiked to over $6 billion
The latest U.S. Consumer Price Index (CPI) report indicated a 0.4% hike in December, bringing the annual inflation rate to 2.9%. This uptick, primarily driven by rising energy costs, has significant implications for financial markets, including cryptocurrencies like Bitcoin (BTC) and Ethereum (ETH).
Market reactions to CPI data
Following the CPI release, Bitcoin’s price rose by 4.12% to approximately $100,510, reflecting investor optimism about potential Federal Reserve interest rate cuts. Ethereum also saw gains in the last trading session, with its price appreciating by over 7% to around $3,451.
These movements suggested that cryptocurrencies are responding positively to inflation data due to their appeal as alternative assets in inflationary environments.
Liquidation dynamics post-CPI release
The total liquidation chart from the last trading session revealed a liquidation surge following the CPI announcement. An analysis of the chart showed that liquidations were almost $330 million.
Ethereum, in particular, saw significant liquidation activity – A sign of heightened market volatility and rapid shifts in investor positions. In fact, liquidations were worth over $67 million.


Source: Coinglass
Additionally, the market saw more short liquidations, with over $223 million in recorded volume.
This trend underscores the sensitivity of these assets to macroeconomic indicators and the speculative nature of its market.
Ethereum Open Interest analysis
Ethereum‘s Open Interest (OI) chart highlighted a notable hike in OI following the CPI data release. Analysis of the OI data showed that it spiked to around $6.5 billion in the last trading session.


Source: CryptoQuant
This uptick suggested that more capital has been entering ETH’s Futures markets, reflecting growing investor interest and potential expectations of future price movements. Worth noting, however, that a high OI can also indicate higher leverage. This may lead to greater volatility.
Ethereum’s price outlook
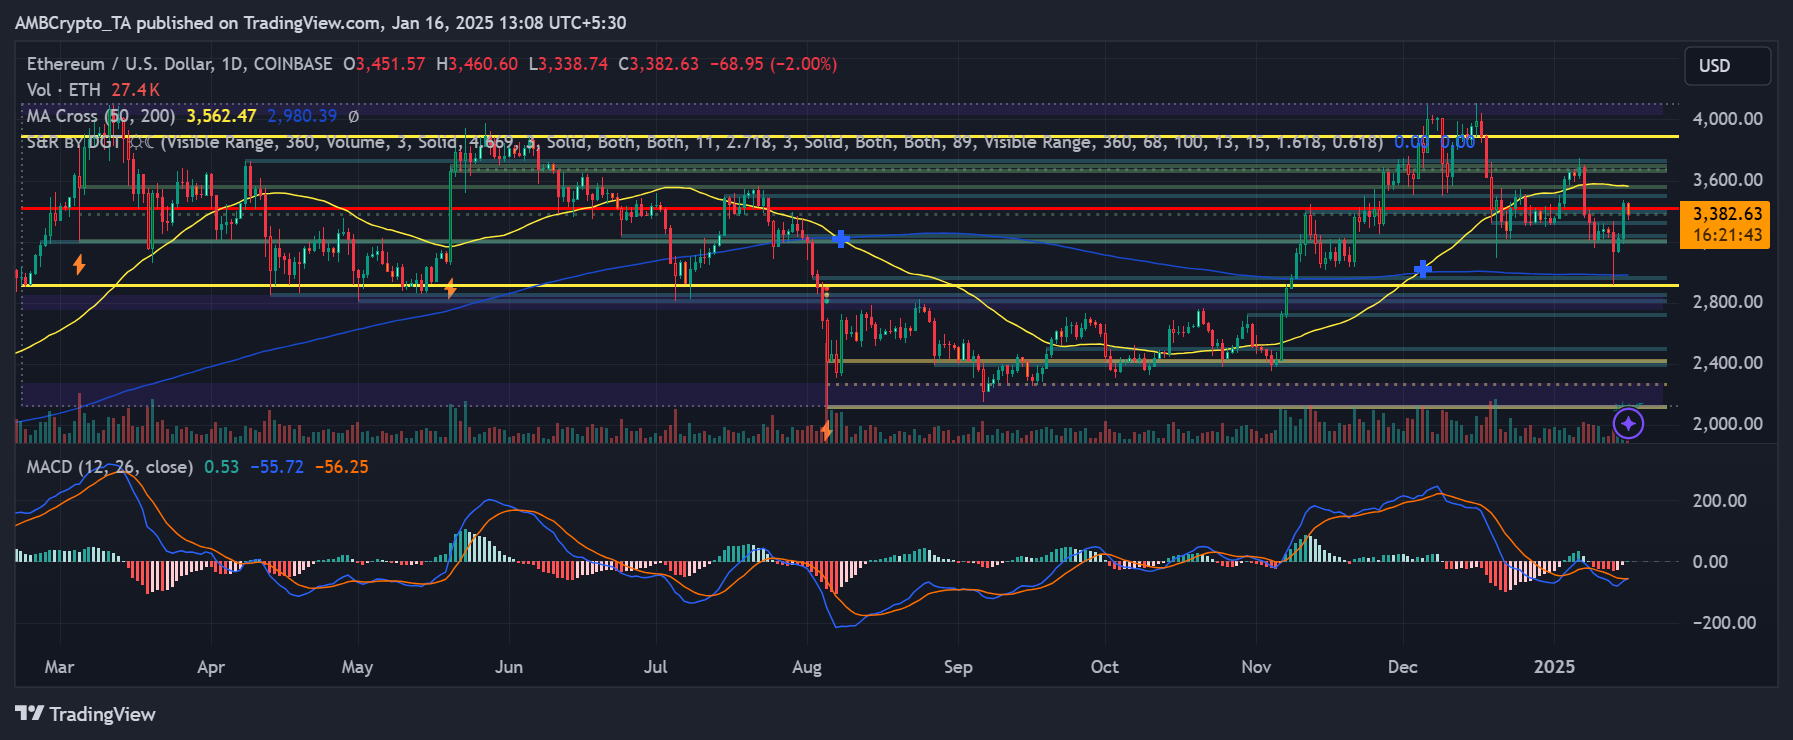
Ethereum’s price action revealed a compelling technical setup, with the 50-day moving average at $3,562.47 maintaining a healthy gap above the 200-day MA at $2,980.39. The MACD indicator readings (0.53, -55.72, -56.25) suggested that momentum is attempting to shift, even though the current structure remains pretty delicate.


Source: TradingView
The altcoin’s latest price movement, influenced by CPI data showing a 0.4% December increase, has pushed ETH to test significant resistance levels. The key support zone at $3,200 is now crucial for maintaining the prevailing market structure, while the $3,500 zone represents immediate resistance.
– Read Ethereum (ETH) Price Prediction 2025-26
Ethereum’s reaction to these macro catalysts could set the tone for its near-term price action. While the derivatives market has been showing signs of increased interest, the balanced liquidation patterns suggest a more mature market response to economic data, when compared to previous cycles.
Source: https://ambcrypto.com/mapping-ethereums-price-reaction-to-decembers-cpi-data/