- Aptos’ double-bottom pattern signaled potential, but low volume and social dominance limited momentum.
- Technical indicators reflected weak bullish momentum, requiring stronger buying pressure for confirmation.
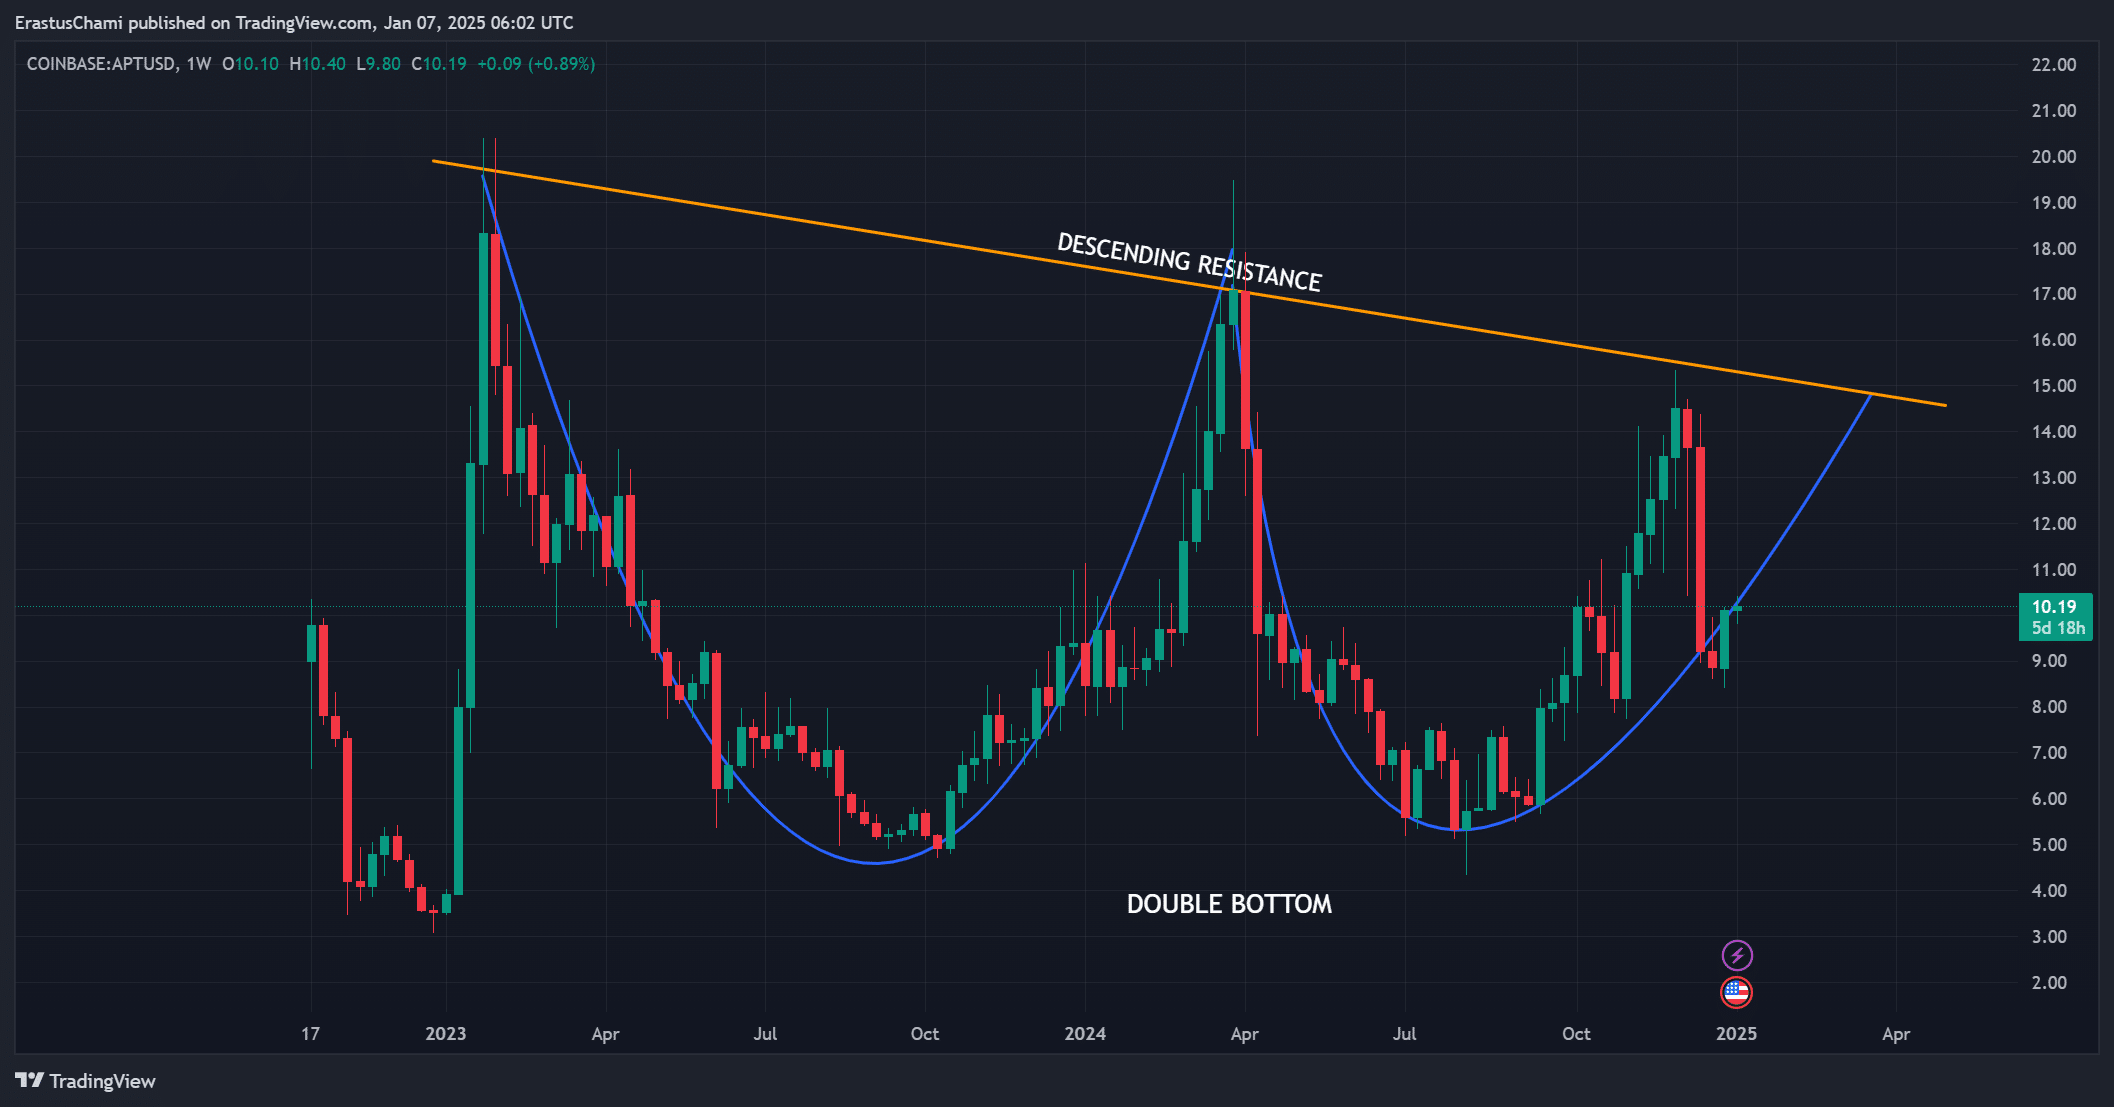
Aptos [APT] is showing signs of a potential recovery, with its price action forming a confirmed double-bottom pattern that has caught the attention of traders.
Trading at $10.22 at press time, reflecting a 2.16% increase at press time, the cryptocurrency was slowly gaining traction. Technical indicators and market activity suggest that Aptos could be entering a critical phase.
Aptos price charts hint at growth potential
The price charts indicated steady progress for APT as it continued to recover from its previous lows. The double-bottom pattern offered strong technical support for further upside movement.
Additionally, incremental gains over the past few trading sessions suggested growing confidence among market participants.
However, the volume remained relatively low, which might limit the strength of the upward push. Therefore, sustained buying pressure will be critical for APT to establish a more robust trend.


Source: TradingView
Low Social Dominance raises questions
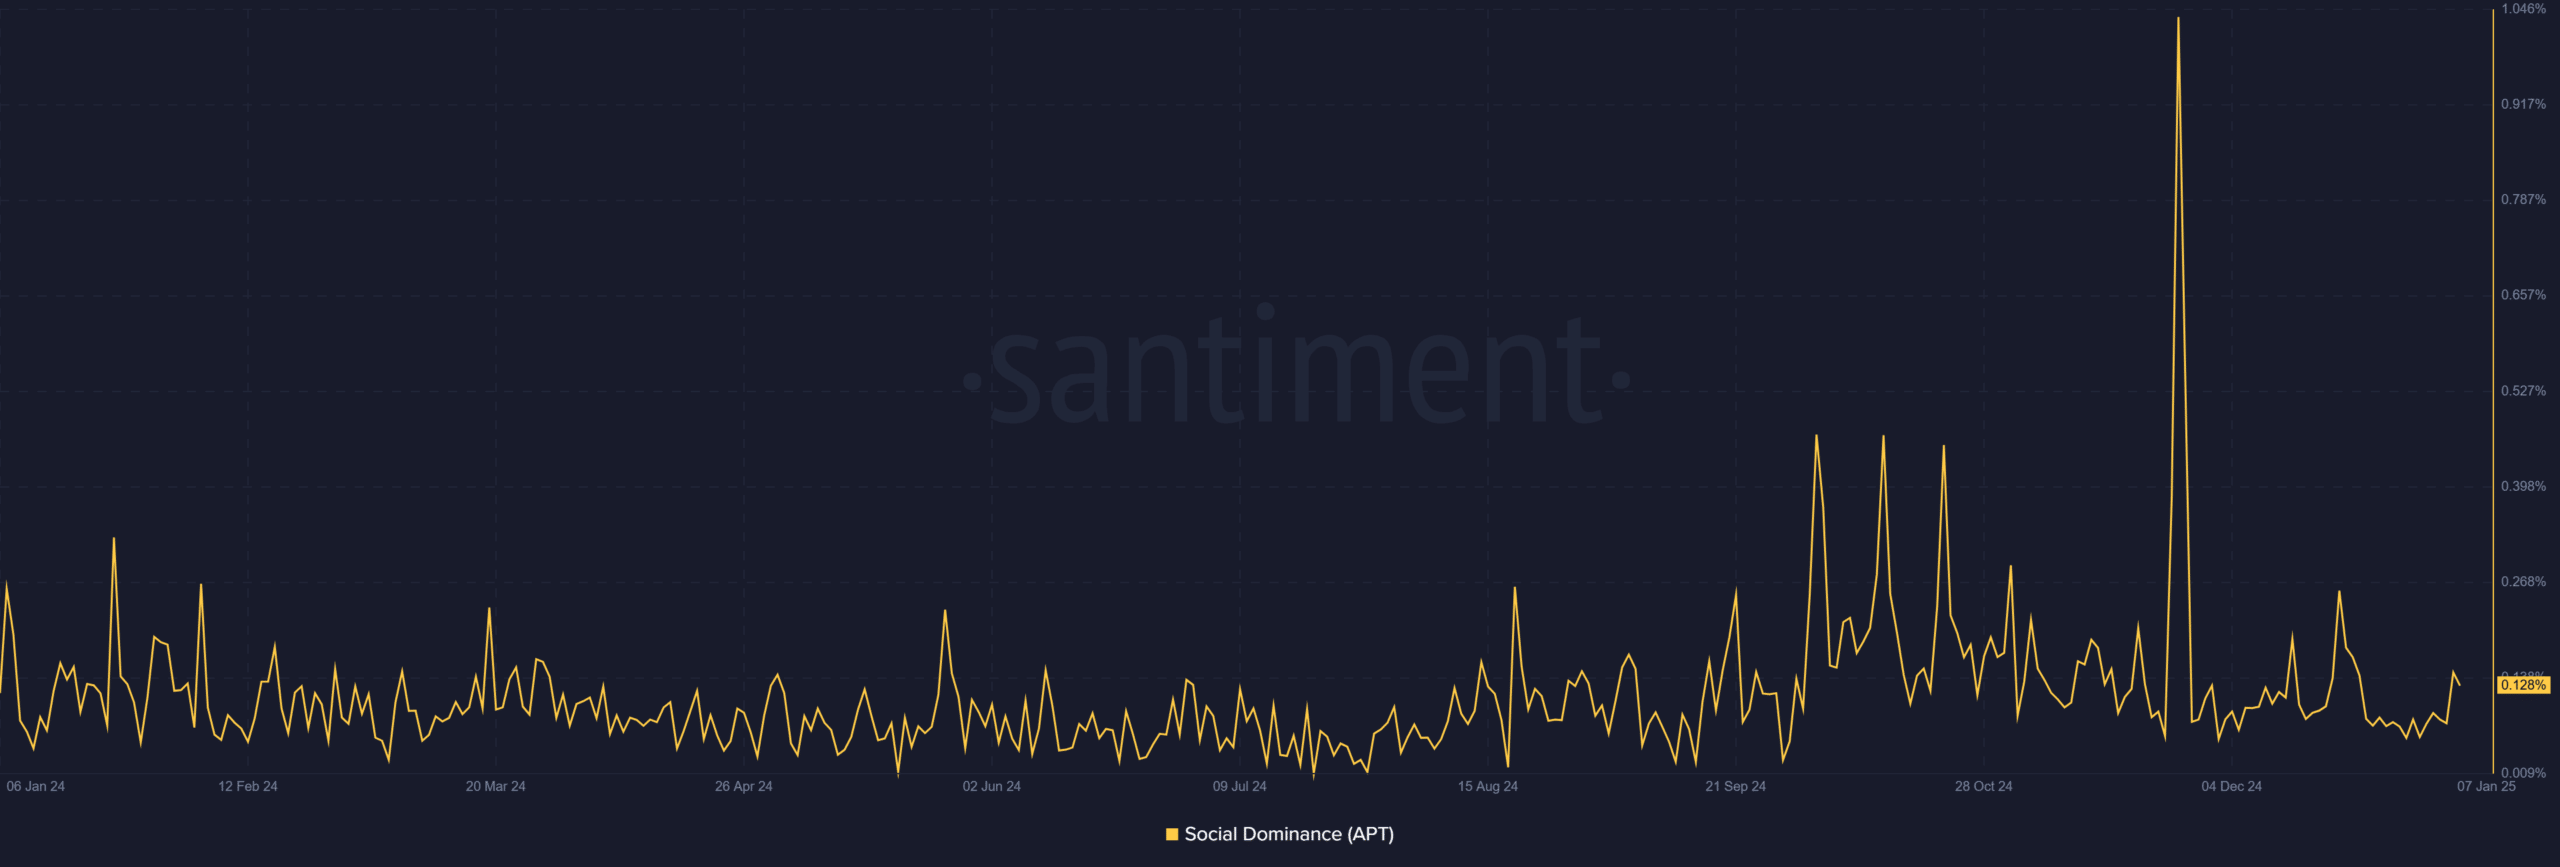
While Aptos exhibited positive technical trends, its Social Dominance remained low, recorded at just 0.128% at press time. This figure underscores the relatively muted buzz around APT compared to other cryptocurrencies.
However, this could also signal an under-the-radar opportunity for further engagement if the price continues its upward trajectory.
Increased social activity, combined with a breakout, could attract more attention and bolster community confidence in the project. Therefore, addressing this gap is crucial for sustained momentum.


Source: Santiment
Trader confidence rises
Liquidation data revealed a significant tilt toward long positions as well, with $58.99k liquidated compared to $15.27k for shorts.
This demonstrated bullish sentiment among traders who anticipated continued upward movement. However, the disparity raises caution, as excessive leverage on the long side could increase volatility.
Traders need to carefully manage their positions to avoid significant losses if the market turns unexpectedly. Therefore, monitoring liquidation trends is essential to understanding market behavior.


Source: Coinglass
APT technical indicators align with bullish sentiment
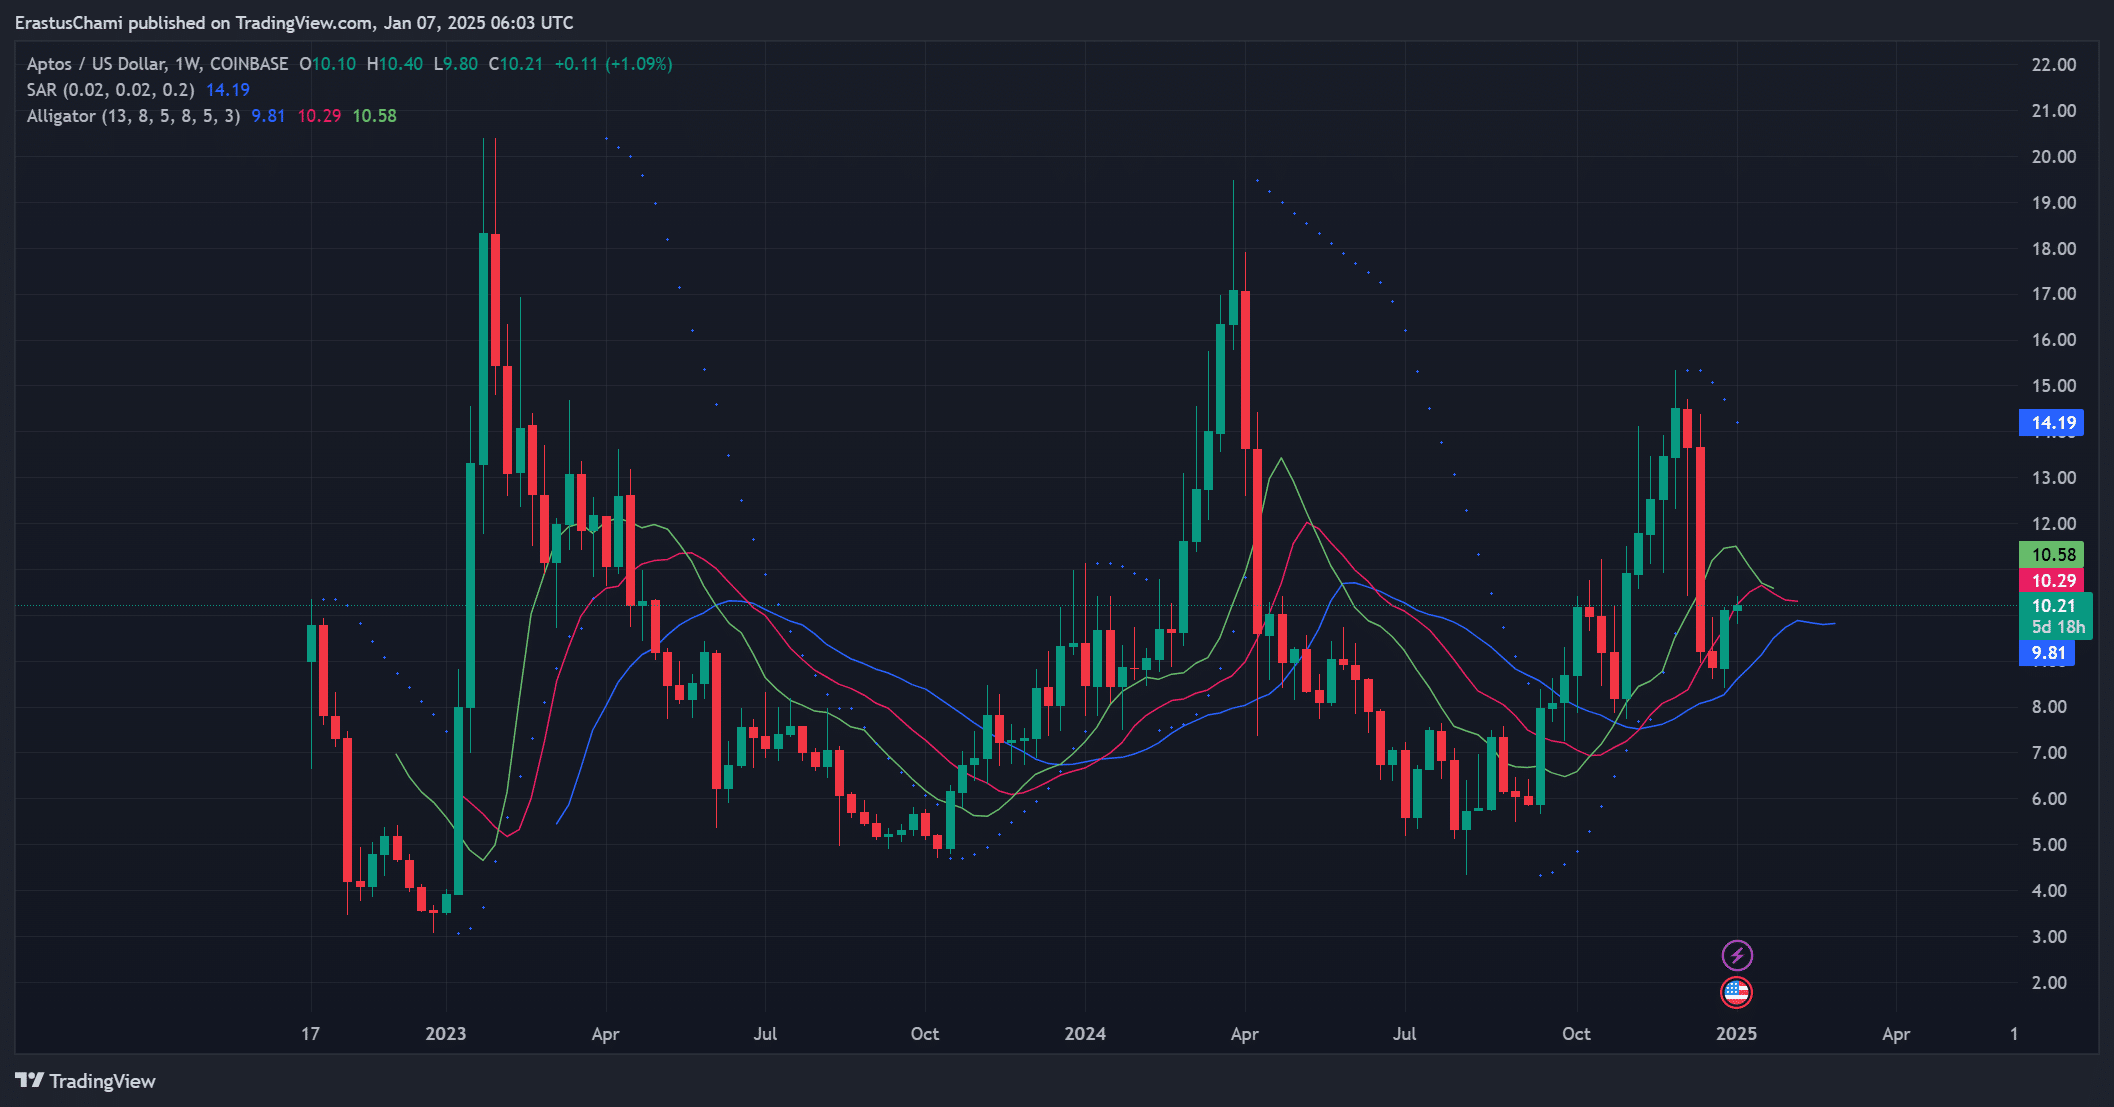
The Parabolic SAR sat at $14.19 at press time, well above the $10.22 price, indicating that the bearish pressure persisted.
Additionally, the Williams Alligator showed limited convergence, with the green line at $10.29 approaching the blue and red lines at $10.58 and $9.81.
These indicators suggested that while APT showed some signs of stabilization, its bullish momentum remained weak. Therefore, stronger buying pressure is required to confirm a trend reversal.


Source: TradingView
Funding Rates reveal steady optimism
The OI-Weighted Funding Rate was 0.0094% at the time of writing, reflecting stable trader sentiment.
This neutral-to-slightly-bullish Funding Rate indicated that traders were cautiously optimistic, maintaining balanced expectations.
The ongoing stability contributes to a healthier market environment, supporting Aptos’ gradual recovery.


Source: Coinglass
Although APT has shown structural recovery with its double-bottom pattern, weak technical indicators and low social engagement present significant hurdles.
Read Aptos’ [APT] Price Prediction 2024–2025
The Parabolic SAR and Williams Alligator highlighted fragile momentum, while social dominance remained limited.
Therefore, Aptos must gain stronger community support and trading activity to confirm its recovery and sustain upward momentum.
Source: https://ambcrypto.com/aptos-shows-early-signs-of-recovery-but-will-this-hinder-apts-upside/