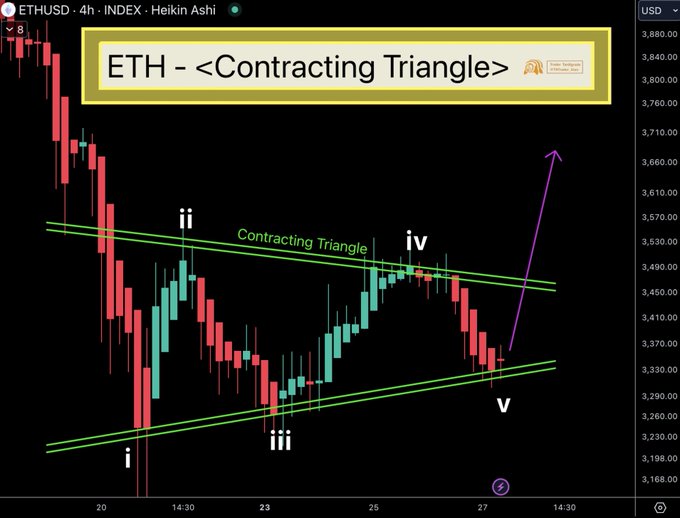
Ethereum price action on the 4-hour chart showed a classic contracting triangle pattern. This pattern formed through a series of lower highs and higher lows, converging towards a point.
The sequence started with a low at $3,168 (wave i), followed by a high at $3,680 (wave ii). Subsequent lows and highs narrowed: $3,260 (wave iii), $3,530 (wave iv), and finally dipping to $3,300 (wave v).
The contracting triangle pattern suggested that ETH had possibly found a local bottom at $3,300. If this triangle pattern completes, the chart suggests potential for an upward breakout.
A successful ascent could target previous resistance levels, converting them into new support zones.

Conversely, a failure to maintain this momentum might see Ethereum price retest the lower boundary of the triangle or even break below, indicating a bearish trend onset.
If this pattern holds true, Ethereum might witness substantial price increases, aiming for new highs in the coming year.
– Advertisement –
Ethereum Price Local Bottom, MVRV Score
Analyzing Ethereum’s market value to realized value (MVRV) ratio revealed its lagging performance in the recent market trend.
When Ethereum price hit $3,962, the MVRV ratio peaked at 2.26, indicating a high investor valuation compared to the realized price.
Despite Ethereum’s price breaching the $4,000 mark, the MVRV ratio climbed only to 1.91, showing diminished investor expectations against the market average.
Currently, with a downturn in price, the MVRV slid to 1.64. This regression suggested that ETH was still trailing behind its March 2024 performance, signaling potential caution among investors.

Historically, an MVRV ratio above 2.25 often preceded major price surges. This level was a critical threshold, where values beyond this point have led to parabolic growth phases in Ethereum price’s market cycle.
Investors anticipating a leadership rally in altcoins driven by ETH may need to temper their expectations until a significant upward MVRV correction occurs.
It’s crucial for the MVRV score to surpass the pivotal 2.25 to predict ETH’s next big movement.
This key indicator served as a bellwether for underlying market sentiment and potential speculative rallies in Ethereum’s valuation.
Ethereum ICO Participant Back in Action
In other event surrounding Ethereum, an ICO participant made a significant move by depositing 631.1 ETH, valued at $2.14M, to Coinbase.
This event occurred as the market saw a rebound, suggesting strategic timing. Originating from the Genesis block in July 2015, this participant initially received 1,940 ETH, then worth merely $601.
Over the years, despite market fluctuations, this early adopter retained a substantial portion of their initial acquisition, now holding 1,309 ETH, currently worth around $4.4M.
The charts and transaction flow showed large outflows directed to major exchanges, indicating possible preparation for further sales.

These often coincide with price recoveries, as large holders capitalize on favorable conditions. This pattern of reactivating after years of inactivity aligns with past behaviors during market upticks.
If this trend continues, Ethereum price might see more significant movements from other dormant addresses.
These developments could signal emerging trends or shifts in the market driven by seasoned participants cashing out on their long-term holdings.
Source: https://www.thecoinrepublic.com/2024/12/28/ethereum-price-local-bottom-at-whales-mvrv-score-have-the-answer/