A notable market watcher provides a timeline for XRP to claim a price that is nearly double its 2017/2018 all-time high.
For context, XRP has been navigating a volatile market environment amid broader bearish trends triggered by hawkish Federal Reserve commentary. Fed Chair Jerome Powell’s recent statements suggested lower-than-expected interest rate cuts in 2025.
A Steep Drop
This reality, coupled with comments around legislative restrictions barring the Fed from holding Bitcoin, has weighed heavily on the cryptocurrency market.
XRP responded with steep losses, plunging 9.91% on Wednesday and another 3.24% the following day. The token dropped to $1.96 on Dec. 20, but bullish momentum emerged, driving a 4.35% rebound to $2.37 at press time this morning.
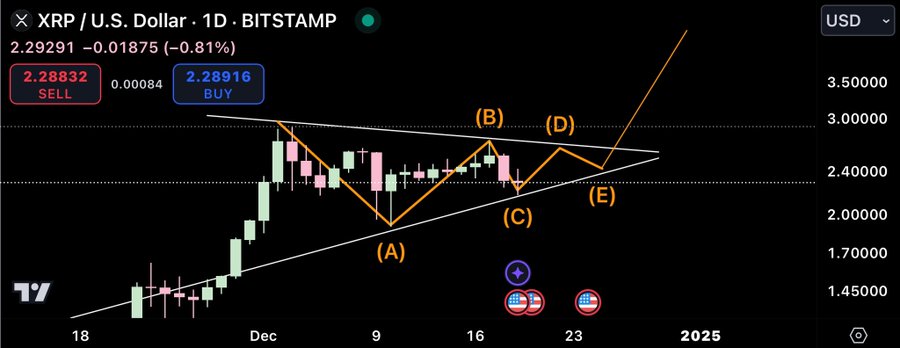
Meanwhile, analysts like CryptoBull believe this correction is a precursor to a major breakout. CryptoBull has shared a chart featuring a symmetrical triangle formation and signaling that XRP may be completing its correction phase.
According to the notable market commentator, this structure will resolve within the next week. He expects such a resolution to propel XRP to a new all-time high of $6 within days of the breakout.
XRP’s Symmetrical Triangle
The 1-day chart shows that the symmetrical triangle pattern developed following XRP’s sharp drop from $2.9, its seven-year peak, on Dec. 3.
This pattern typically represents market indecision, with prices consolidating as bulls and bears compete for dominance. Notably, with XRP now close to the triangle’s apex, this position suggests a breakout is imminent.

The structure began with a steep decline (wave A), followed by a recovery (wave B). However, the latest correction has triggered a steeper drop to lower lows, representing wave C.
CryptoBull’s chart suggests the impending recovery could allow XRP again retest the upper trendline of the triangle, completing wave D. Nonetheless, the chart indicates that this retest will lead to another pullback (wave E), with a recovery from this pullback potentially breaching the triangle’s resistance.
For context, key price levels in the chart include $2.4 as immediate resistance and $2.0 as a major support. A breakout above $2.4 could see XRP testing its previous high of $2.9 before targeting the $6 milestone. CryptoBull believes $6 could materialize in the next few days.
XRP Following 2017 Fractal
In a separate analysis, CryptoBull drew parallels between XRP’s current trajectory and its historic 2017 rally. Particularly, in March 2017, XRP began a multi-month surge that culminated in an all-time high.
It still looks like #XRP is repeating the 2017 pattern. We repeated the first monthly candle from March 2017 and hit the $1.96 target. Next would be $6.28 by the end of this month and around $40 by the end of January 2025. pic.twitter.com/LGWiTRn6vq
— CryptoBull (@CryptoBull2020) December 19, 2024
The analyst suggests XRP is mirroring this pattern, having already achieved a key target of $1.96. If this pattern holds, CryptoBull says XRP could hit $6.28 by the end of December 2024. Furthermore, he predicts a meteoric rise to $40 by the end of January 2025.
DisClamier: This content is informational and should not be considered financial advice. The views expressed in this article may include the author’s personal opinions and do not reflect The Crypto Basic opinion. Readers are encouraged to do thorough research before making any investment decisions. The Crypto Basic is not responsible for any financial losses.
Source: https://thecryptobasic.com/2024/12/21/market-analyst-predicts-timeline-for-xrp-to-hit-6/?utm_source=rss&utm_medium=rss&utm_campaign=market-analyst-predicts-timeline-for-xrp-to-hit-6