- LINK spiked by over 30% in the last 24 hours.
- It remained undervalued overall despite this spike in price.
As Chainlink [LINK] crosses significant milestones, including a $15.87 billion market cap and a price rally to $25.08, the question arises: is LINK still undervalued?
With its crucial role in powering decentralized finance (DeFi) through Oracle services, Chainlink’s fundamentals and on-chain metrics suggest a story of growing utility and demand.
AMBcrypto’s analysis of its Total Value Secured (TVS), daily active addresses, MVRV ratio, and price action provided insights into whether LINK’s current valuation aligned with its potential.
Rising demand for Chainlink oracles
The TVS chart from DeFiLlama revealed Chainlink’s expanding dominance in the DeFi ecosystem. Having climbed steadily throughout 2024, the TVS exceeded $60 billion at press time.
The increase reflected increased adoption of Chainlink’s data feeds across decentralized applications.


Source: DefiLlama
The rising TVS aligns with the increased activity across DeFi protocols, with Chainlink benefiting as more projects integrate its Oracle solutions.
Given its market cap-to-TVS ratio, LINK appears undervalued compared to its contribution to securing decentralized ecosystems.
Uptick in network participation
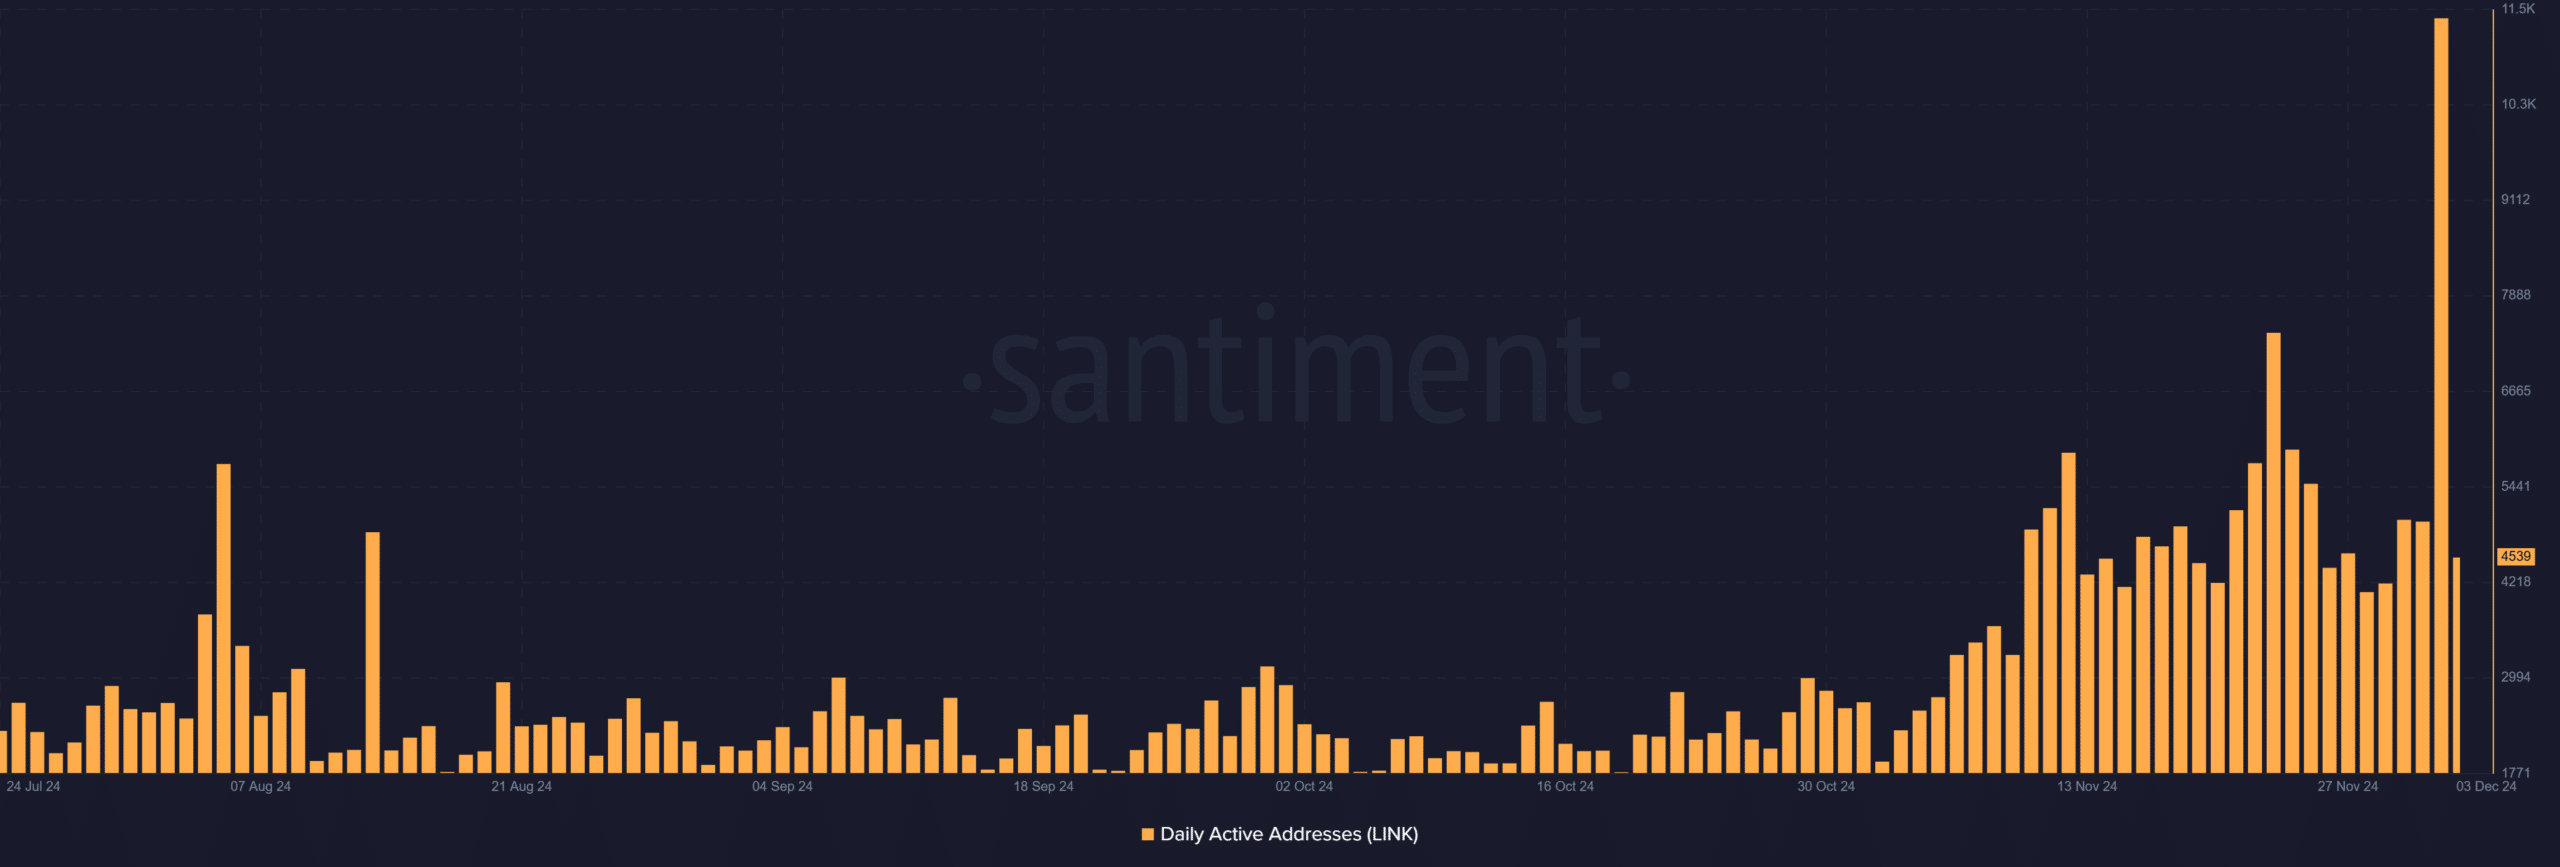
Analysis of the daily active addresses chart highlighted a surge in network activity, peaking at over 11,455 addresses on the 2nd of December. This showed heightened user interest and engagement.
Notably, the spike coincided with LINK’s recent price rally, indicating that new participants may be entering the ecosystem during bullish market conditions.


Source: Santiment
Such a rise in active addresses typically correlates with increased on-chain utility. Sustained growth in this metric could further support Chainlink’s value appreciation.
Evaluating LINK’s valuation
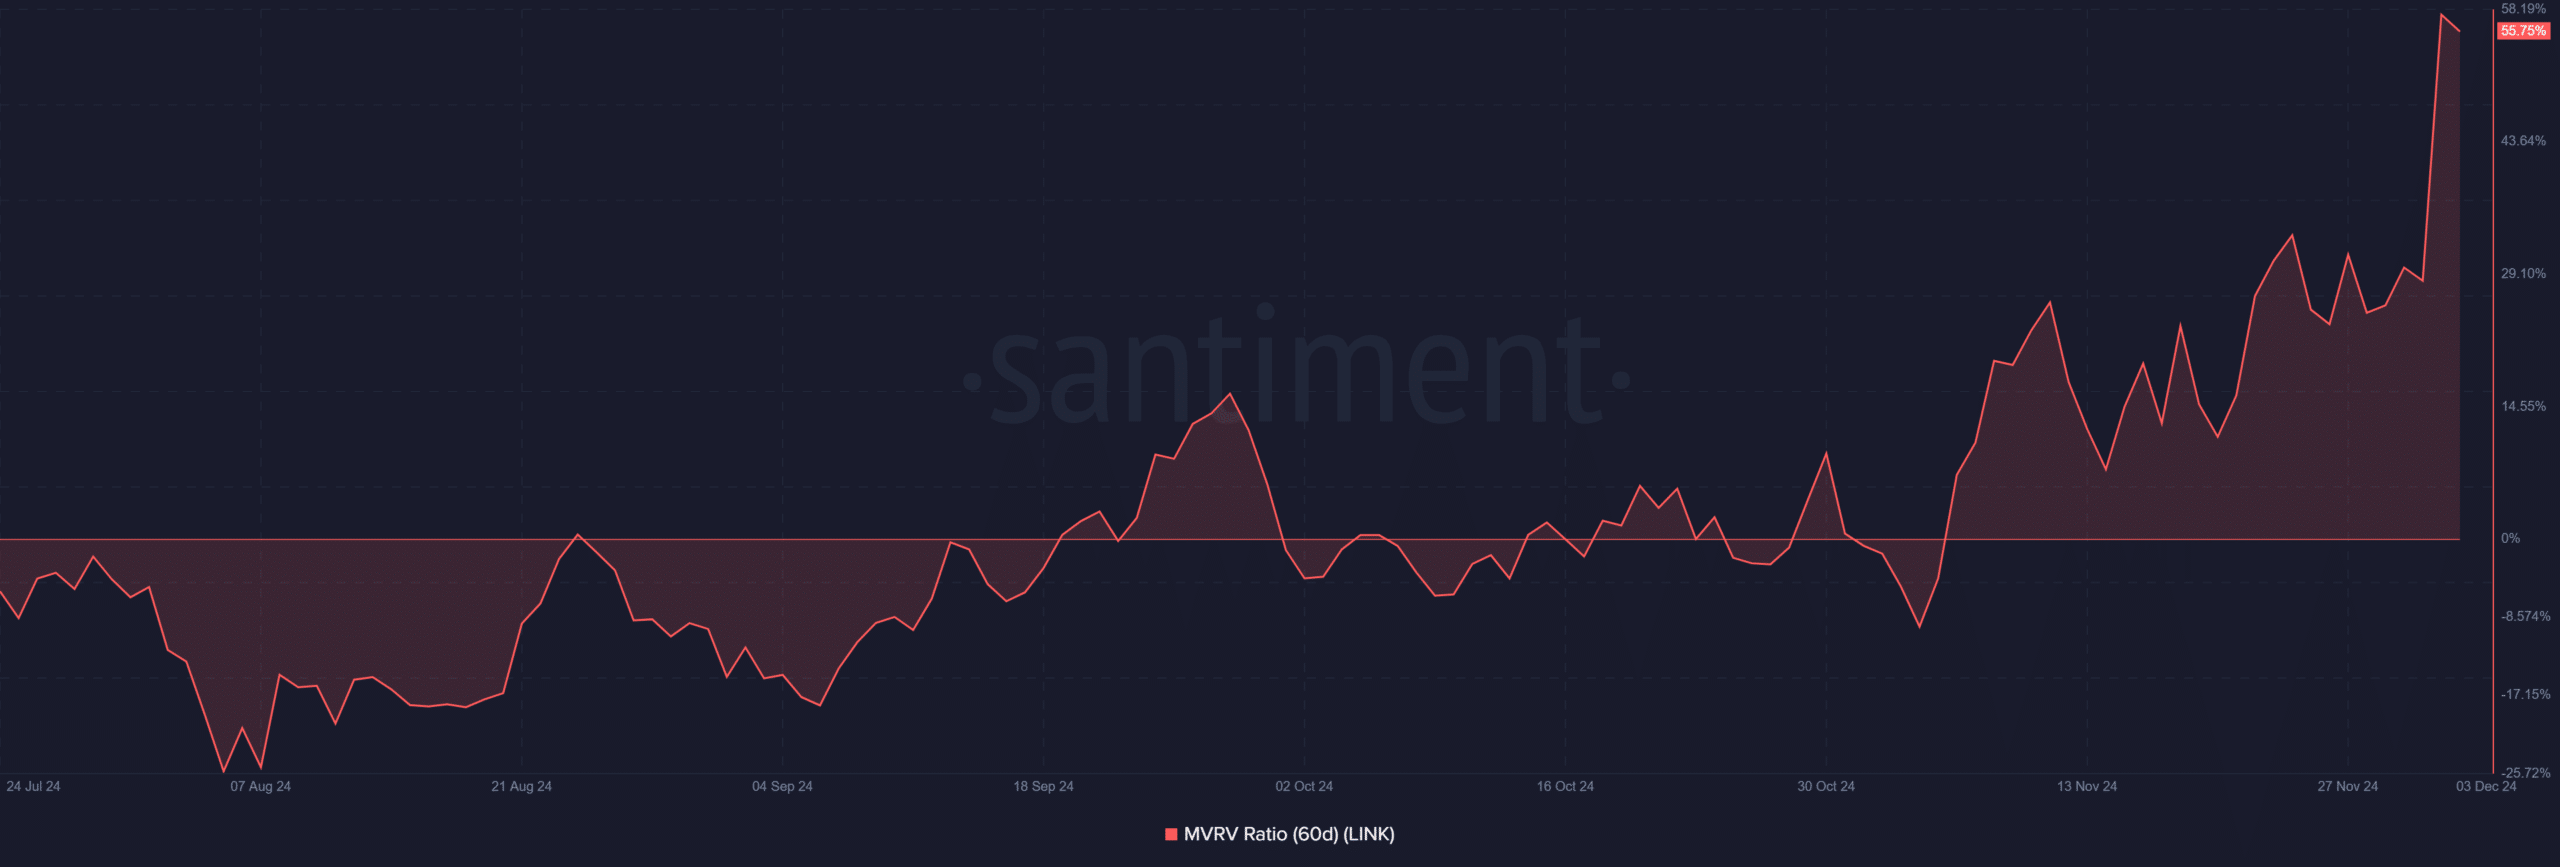
The 60-day MVRV ratio for Chainlink has surged above 55%, indicating that the average holder was sitting on significant unrealized gains.
Historically, elevated MVRV levels suggest a higher likelihood of profit-taking and potential short-term corrections. However, LINK’s price trend amid these levels reflected strong market confidence.


Source: Santiment
While the MVRV ratio signals that LINK might be entering overbought territory in the short term, its long-term trajectory appears strong, supported by its growing TVS.
Technicals back a bullish narrative
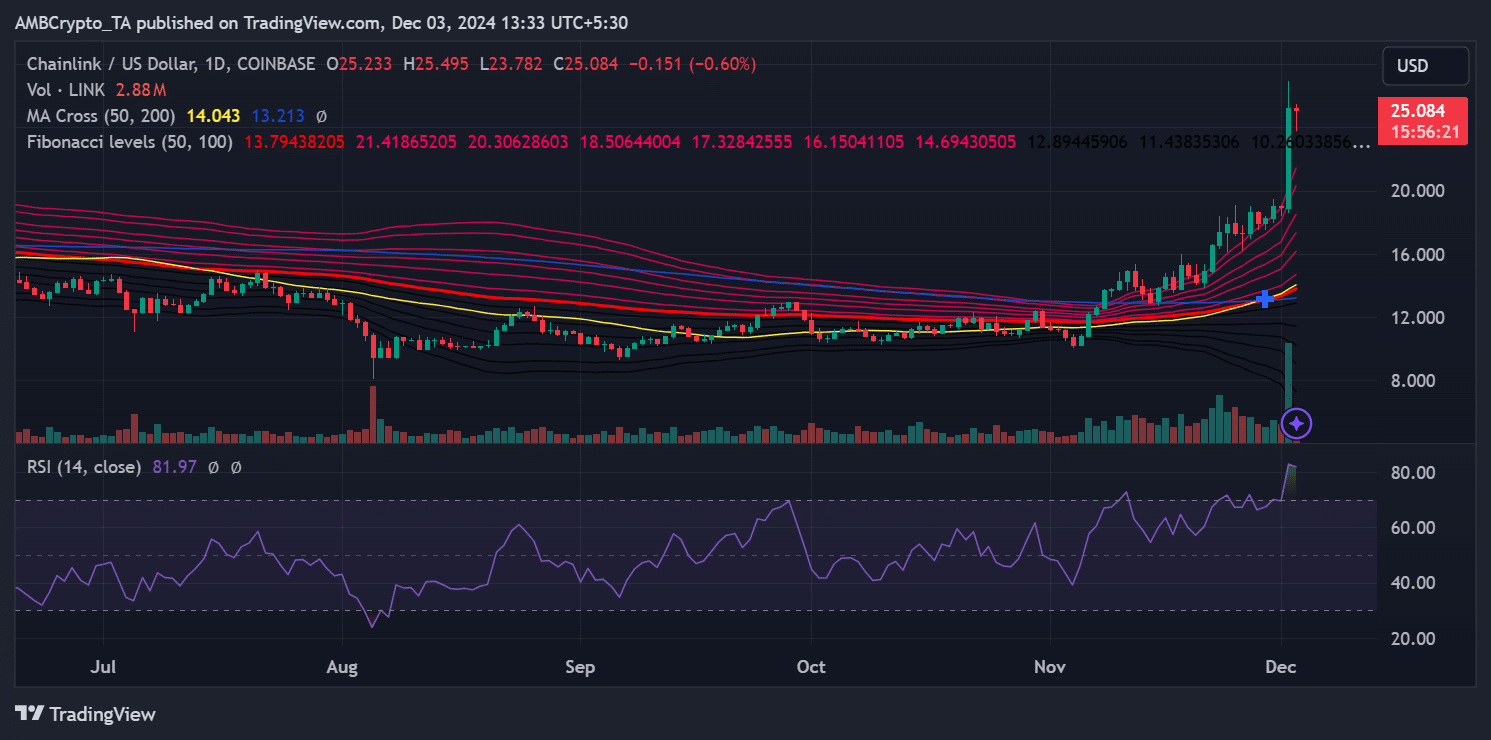
AMBCrypto’s analysis of the Chainlink chart revealed a breakout above key resistance levels, supported by strong trading volumes.
The token has maintained a bullish trajectory, trading well above its 50-day and 200-day moving averages. The RSI, however, indicates overbought conditions at 81.97, suggesting that a short-term correction could be on the horizon.


Source: TradingView
Fibonacci retracement levels highlighted $23.78 and $20.43 as potential support zones if LINK retraces from its current highs.
On the upside, the next resistance levels could be $28 and $30, providing opportunities for further growth if bullish momentum persists.
Realistic or not, here’s LINK’s market cap in BTC’s terms
The elevated MVRV ratio and overbought RSI suggest the possibility of short-term corrections, but the broader trend points to long-term growth potential.
Considering Chainlink’s growing utility, expanding adoption, and relatively modest market cap-to-TVS ratio, LINK still appears undervalued in the context of its role in the crypto ecosystem.
Source: https://ambcrypto.com/chainlink-despite-30-rise-in-24-hours-is-link-still-undervalued/