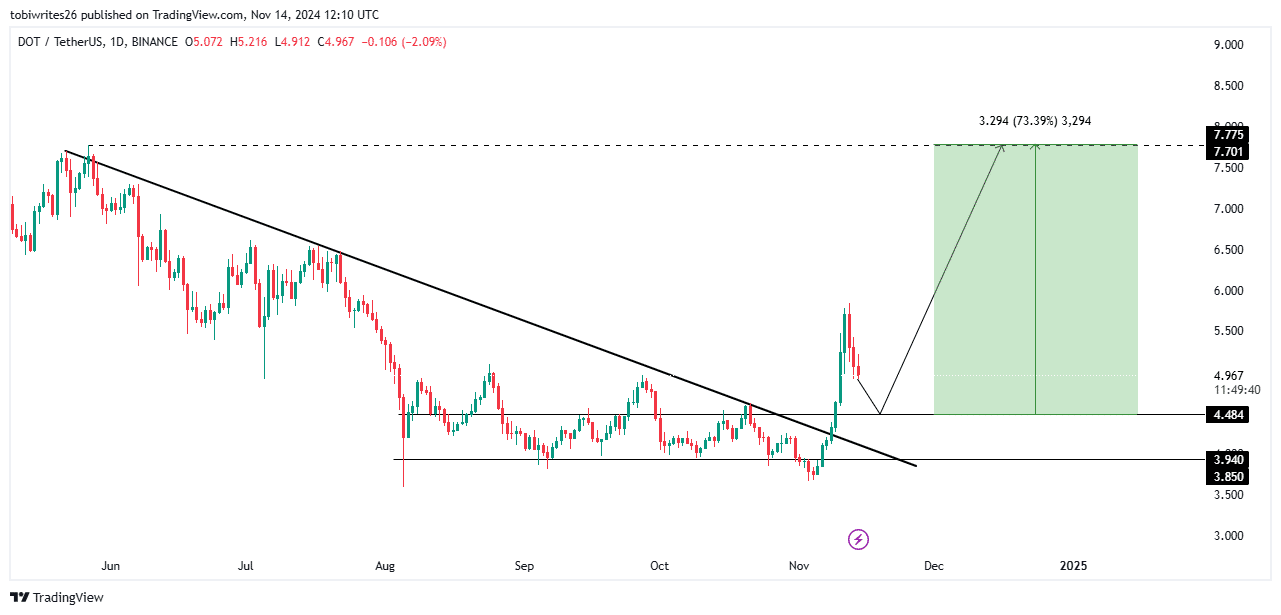
- DOT is expected to see a decline from its press time level, according to market indicators and sentiment analysis
- If sufficient buying pressure emerges at the support level, a strong rebound can be anticipated
Polkadot’s [DOT] recent 21.81% weekly gains may stall soon, especially since the asset has started to decline already. At the time of writing, DOT was down 1.81%, with the altcoin likely to head further south soon.
AMBCrypto’s latest analysis underlined the next target level for DOT, indicating where a potential rebound may occur.
Bearish pressure builds as traders bet on DOT’s decline
According to the prevailing market sentiment, DOT may be positioned for further decline from its press time price levels.
Spot traders seemed to have initiated a downtrend by moving their DOT holdings from private wallets to exchanges for sale. in fact, recent data revealed Exchange Netflows of $125.72 million worth of DOT into exchanges – A sign of strong selling interest.


Source: Coinglass
Adding to the bearish sentiment, a significant amount of long positions have been liquidated in the market. In the last 24 hours, $1.21 million in long positions were removed, indicating major losses for traders who had anticipated an uptrend.
Meanwhile, only $151,000 in short positions have been closed, creating a notable imbalance that shifts the market strongly in favor of the bears.
Anticipated DOT drop – Where will it find support?
According to AMBCrypto’s technical analysis, DOT’s next potential support level can be identified on the chart. In fact, its press time price action suggested a drop towards $4.484, where it may find support necessary for an upward push. If sufficient buying orders emerge at this level, DOT could rally by 73.39%, hitting a target of $7.75.
Should this support level fail, DOT may fall further to a lower support at $3.940, where enough liquidity could drive prices higher. However, it may need to consolidate at this level, as it has previously.


Source: Trading View
Liquidity outflows signal potential DOT retracement
The Money Flow Index (MFI) and Chaikin Money Flow (CMF) indicators for DOT highlighted a downtrend.
These technical indicators, which use volume and price to gauge market sentiment, remained positive despite declining. At press time, the MFI had a reading of 56.99, while the CMF flashed 0.20 – Both in positive territory.

Source: Trading View
Although both the MFI and CMF were in positive territory, their decline alluded to a temporary pullback, rather than a complete trend reversal. Hence, while DOT’s press time price action appeared bullish, the decline may only be temporary before an upward continuation.
Source: https://ambcrypto.com/analyzing-dots-latest-price-fall-ahead-of-its-potential-73-gains/