- Recently, JUP encountered a significant hurdle as it failed to break above a key resistance level, leading some traders to sell.
- Despite this, bullish sentiment remains strong, helping JUP avoid a sharp decline amid recent selling activity.
Jupiter’s [JUP] market performance has been impressive, positioning it ahead of some other tokens. Over the past month, it gained 45.85%, with an additional 5.89% increase in the last 24 hours.
However, there was uncertainty about whether this rally will sustain, as some market participants were buying while others were selling.
Jupiter’s bullish potential could drive price to $1.8
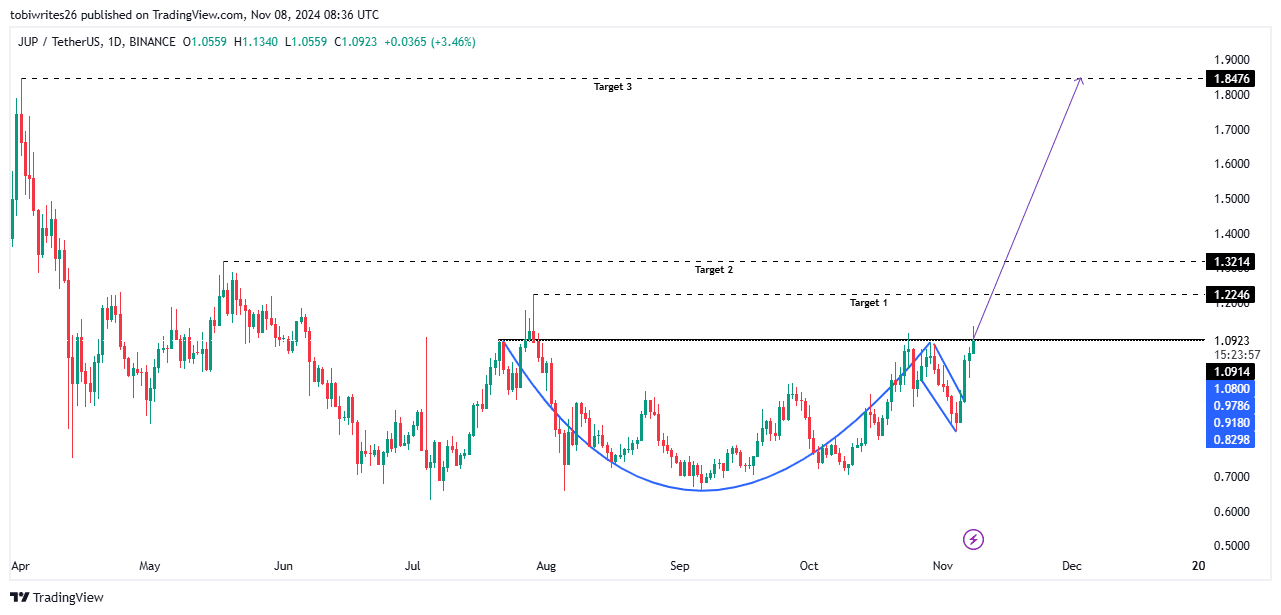
On the chart, JUP was showing bullish signs, forming a “cup and handle” pattern (marked in blue in the image below) — a formation that often signals an upcoming upward move.
For this bullish trend to materialize, JUP must first break through the key resistance level at $1.0914 which potentially houses a major selling pressure. If this level is breached, there were three potential targets to consider: $1.22, $1.32, and the long-term target of $1.8.


Source: Trading View
Further analysis indicated a strong likelihood that this rally could unfold.
Accumulation continues, supporting bullish momentum
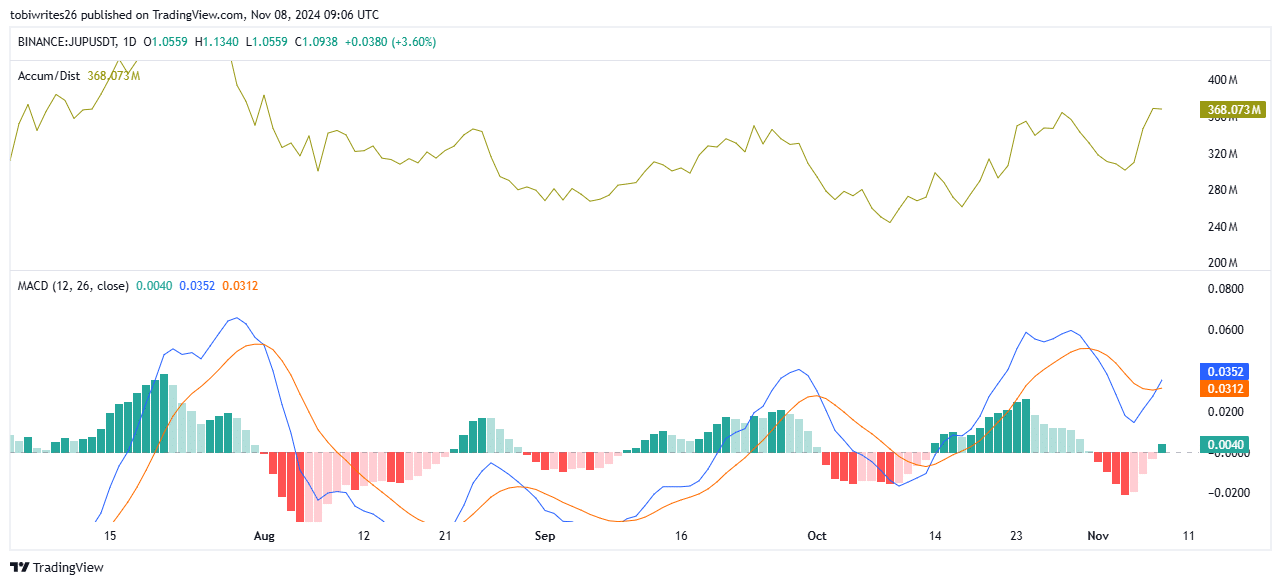
Accumulation was ongoing, trending upward with potential to rise even further. Currently, volume stands at 367.829 million, indicating strong buying activity.
The A/D (Accumulation/Distribution) indicator measures volume flow in and out of an asset, helping traders gauge buying or selling pressure by combining price and volume to reflect market sentiment.
Meanwhile, the Moving Average Convergence Divergence (MACD) indicator was also trending upward, moving into positive territory, which supported a bullish outlook.
The MACD has formed a “Golden Cross” pattern, where the blue MACD line crossed above the orange Signal line. This pattern often precedes a significant rally, potentially driving JUP toward its projected target of $1.8.


Source: Trading View
Adding to this bullish sentiment was the Open Interest, which reflects the number of unsettled contracts in the market. Currently, long contracts dominated with a 17.17% increase, amounting to $139.51 million according Coinglass.
Selling pressure could stall JUP’s rally
AMBCrypto has noted significant selling activity on JUP that could potentially hinder its rally. Key indicators of this selling pressure include the negative Funding Rate and positive Exchange Netflow.
At the time of writing, the Funding Rate dropped to -0.0007, indicating that short positions were paying long positions to keep their trades open. Similarly, the Exchange Netflow has remained predominantly positive across all time frames, from hourly to weekly.


Source: Coinglass
Realistic or not, here’s JUP’s market cap in SOL terms
This suggested that spot traders were moving Jupiter onto exchanges to sell, adding downward pressure on the asset. In the last seven days, approximately $11.05 million worth of JUP has been deposited into exchanges.
If these metrics continue to exert downward pressure and selling persists, JUP’s price is likely to trend downward.
Source: https://ambcrypto.com/jupiters-cup-and-handle-pattern-can-drive-it-higher-but-theres-a-catch/