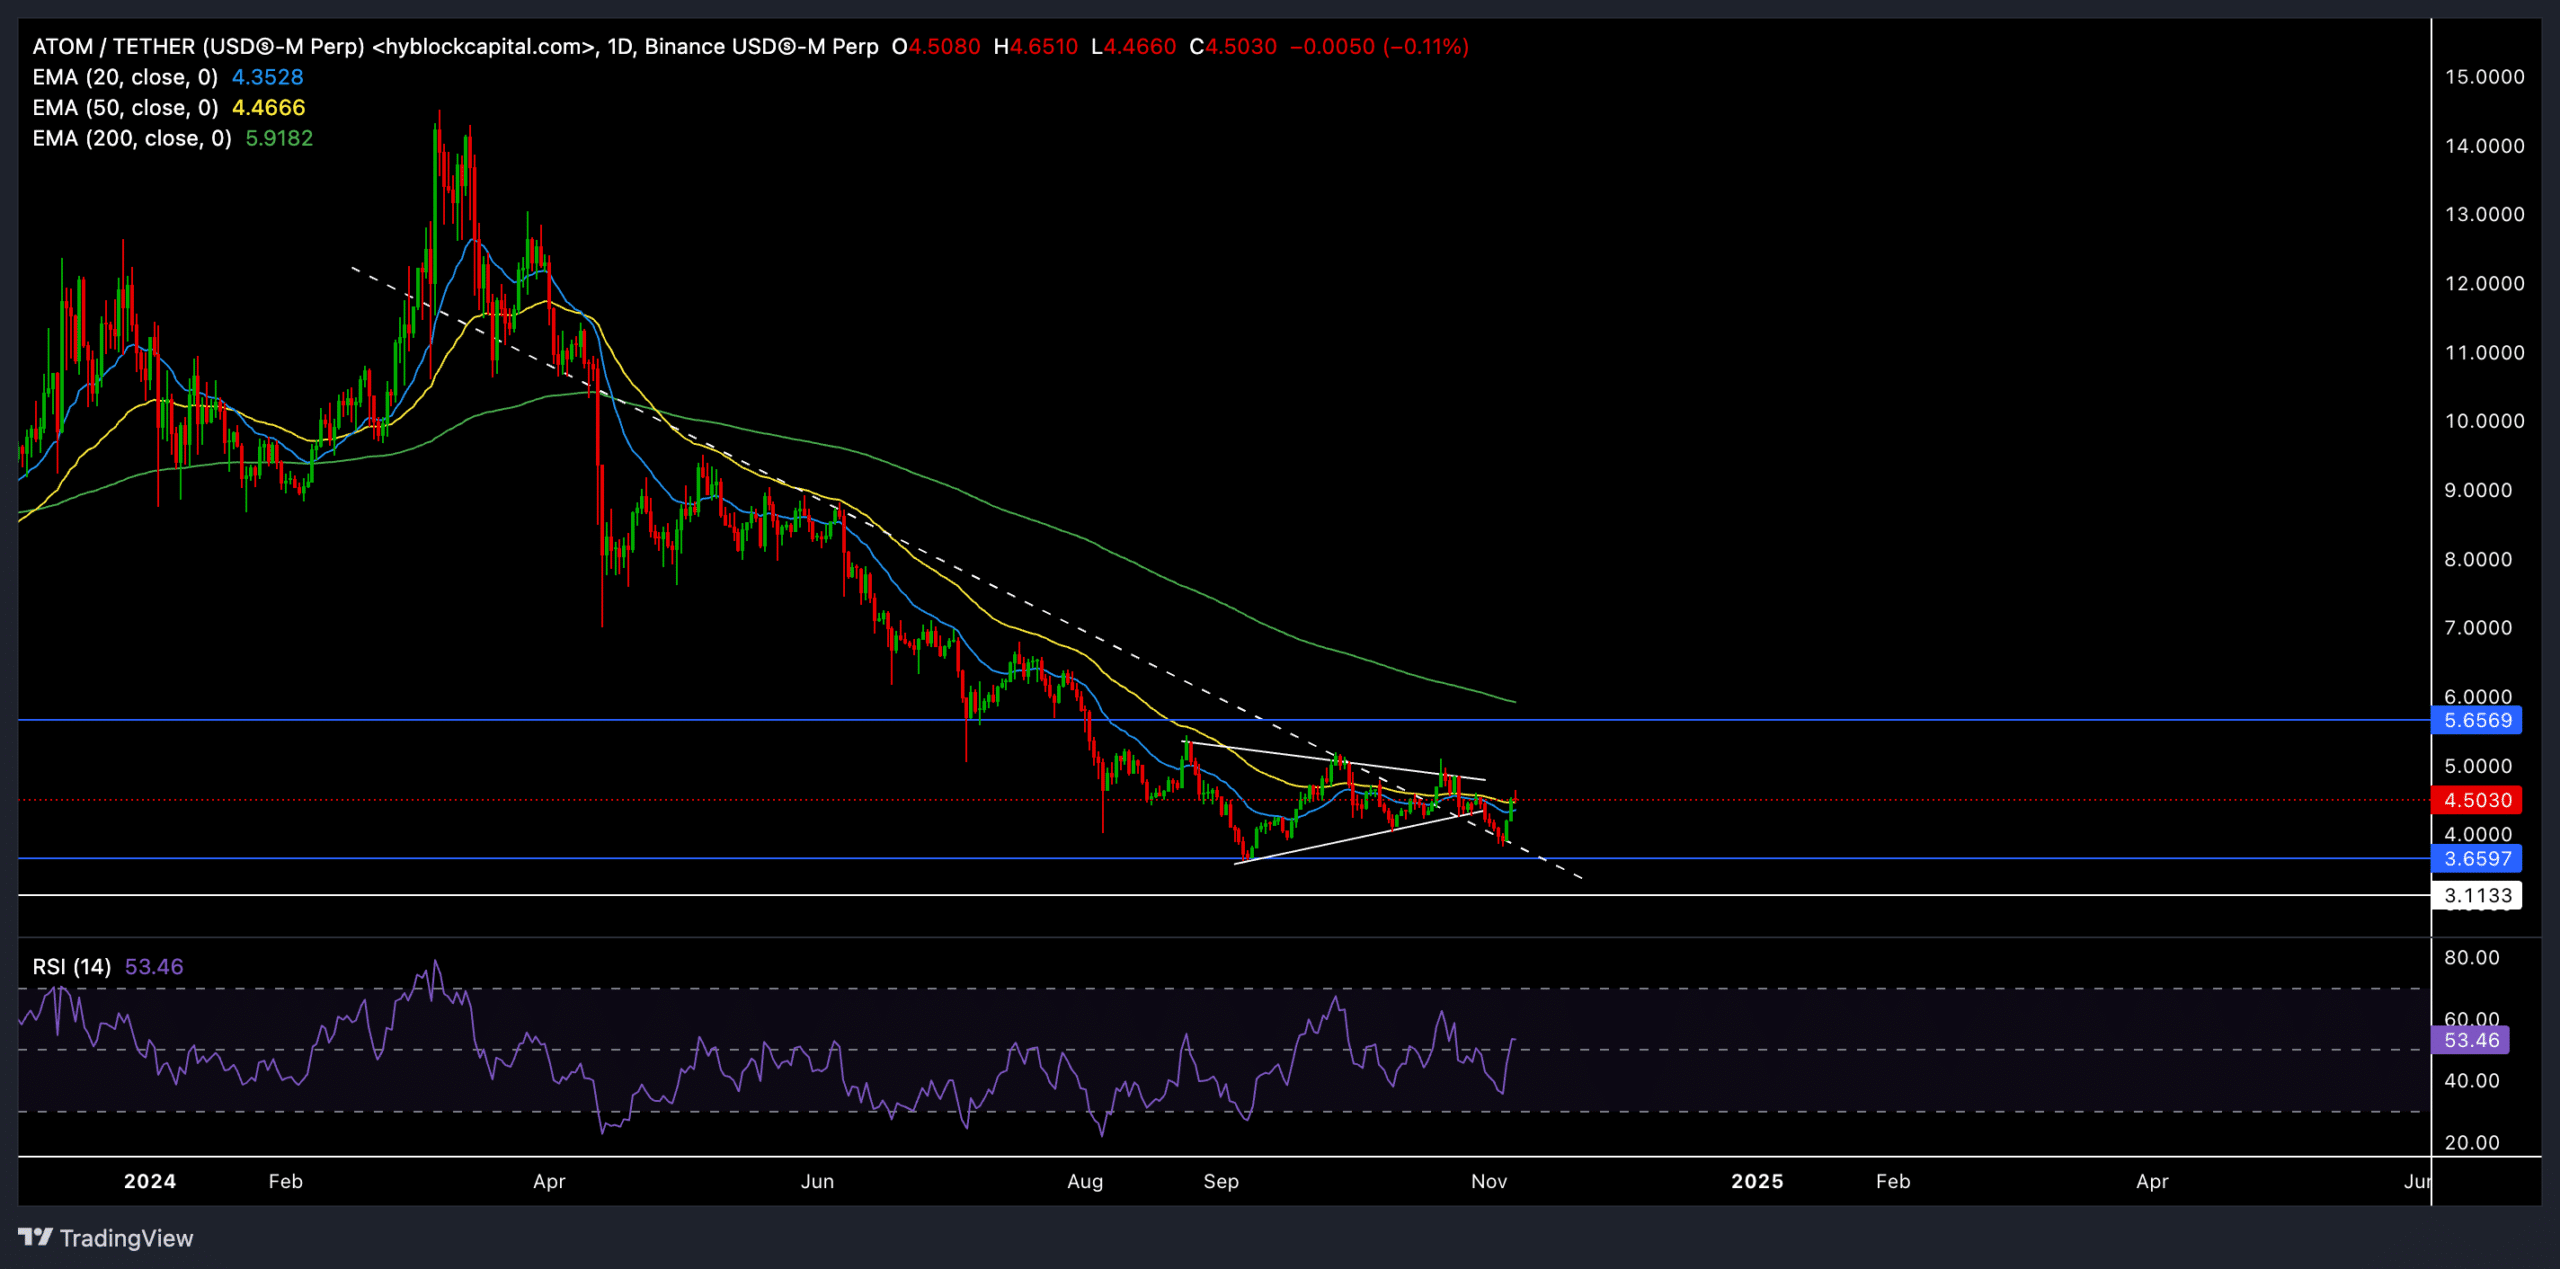
- Cosmos recovered by 15% over the last two days, with immediate resistance from the 50-day EMA still looming
- If buyers break this barrier, they could push ATOM toward the 200-day EMA
Cosmos [ATOM] recently rebounded from its long-term trendline support as the altcoin flashed a symmetrical triangle-like structure on its daily chart. This price action saw a strong recovery amid a Bitcoin rally towards its new all-time high above $75K.
Can ATOM sustain its bullish momentum, or will it face another pullback?
What to expect next?


Source: TradingView, ATOM/USDT
ATOM bounced back from its critical trendline support (white, dashed) after witnessing a bullish rebound over the past few days. The altcoin was trading at $4.50 at press time, just above the 20-day EMA ($4.35) and the 50-day EMA ($4.47) – Both of which have been key resistance levels. A decisive close above these EMAs could set the stage for further gains towards the $5.66 resistance level.
However, if ATOM fails to hold above these EMAs, it may face another decline towards the $3.65 trendline support. This level has stood firm for the past few months.
The RSI stood at around 53, at the time of writing. It underlined neutral market momentum with a slightly high buying pressure. A consistent hike above the 60-mark could indicate renewed bullish sentiment. On the other hand, a dip below the 40-level would mean a weakening trend.
Key levels to watch
Support Levels: ATOM’s immediate support lay near $3.65, aligning with the long-term trendline. A break below this level could lead to a deeper decline towards $3.11 – another critical support level.
Resistance Levels: On the upside, ATOM seemed to face immediate resistance at the 50-day EMA ($4.47) and $5.66. A successful break above these levels could propel the altcoin towards testing higher levels, contingent on broader market sentiment.
Derivative data revealed THIS

Source: Coinglass
ATOM’s trading volume saw a sharp decline of 27.67% over the last 24 hours, suggesting cautious participation from traders amid recent market volatility.
Despite the volume drop, Open Interest increased by 1.39%, showing market participants retaining their positions and potentially anticipating a breakout or trend reversal.
ATOM’s overall long/short ratio stood at 0.9736, indicating a relatively balanced sentiment. On Binance and OKX, the long/short ratios were quite bullish, at 2.864 and 2.68, respectively, suggesting optimism among traders.
Additionally, Binance liquidation data revealed more short liquidations than longs, indicating that recent price movements caught bears off guard. Traders should also consider Bitcoin’s price action, as it will likely influence the broader market direction and ATOM’s movements.
Source: https://ambcrypto.com/cosmos-atom-traders-should-look-for-these-signs-before-going-long/