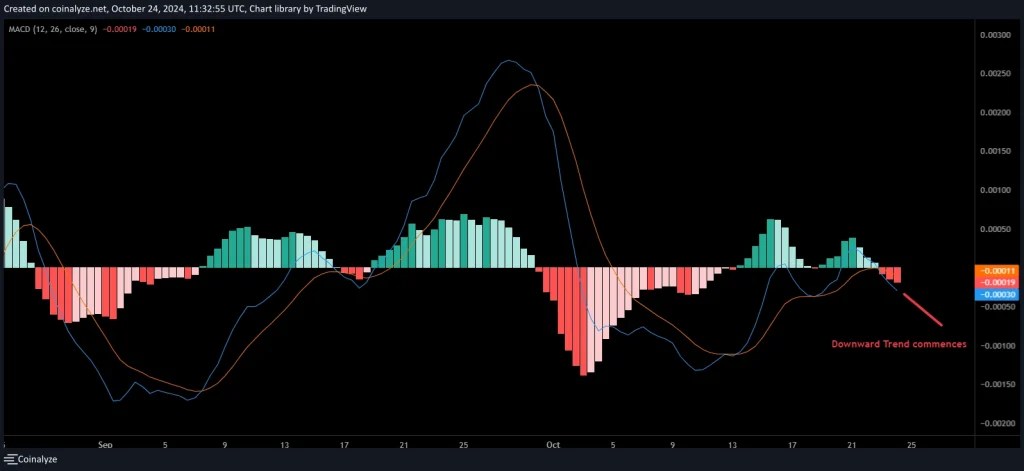
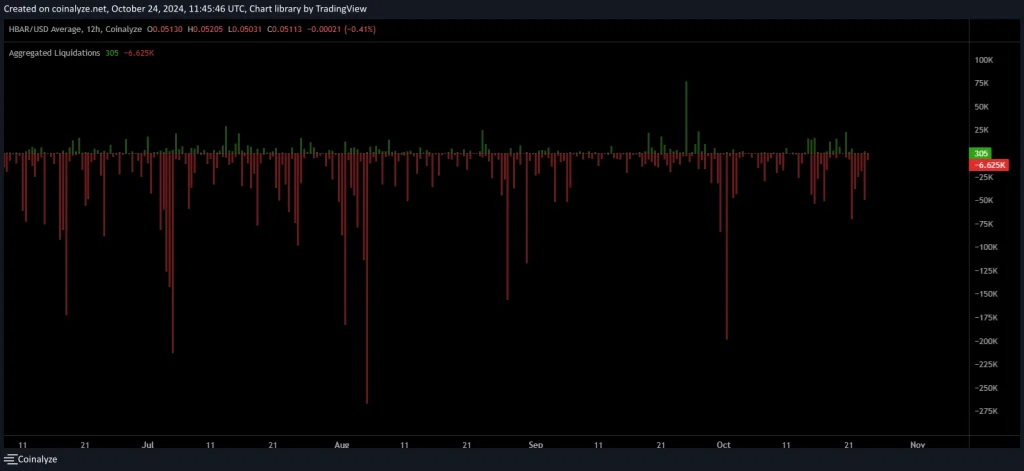
Hedera or HBAR is priced at $0.0505 currently, which is a slight decline of 1.2% in the last 24 hours. Hedera’s current price movements suggest a downward price trajectory, which is reflected in both the MACD and liquidity charts.
While the token price has been up by 0.54% in the last seven days, the overall sentiment for Hedera remains negative as there is an increase in sell-offs, and the buying momentum is gradually descending.
What Does Hedera’s Future Hold?


When going by the MACD chart shows a clear downward crossover between the MACD line and the signal line, which showcases a downward shift. Moreover, the histograms have dipped into negative territory, further signaling a strengthening of the downward slope. HBAR price prediction states a strong sell-side inclination, which further reinforces the technical analysis.
This trend, along with the decline in buying interest, indicates that HBAR is likely entering a period of persistent downward pressure. Traders should tread the market with caution as this could mean further price dips are on the horizon.
Moreover, the recent shift in the histogram from green to red highlights that the positive momentum that was seen in the market previously is slowly waning the position, and the direction of the chart further supports this ongoing bearish sentiment.


The liquidity chart also reveals a substantial trend in liquidations where sell-offs are outpacing orders. In the recent weeks we have seen several notable spikes in liquidations totaling to about 6.62K HBAR. This pattern of rampant and frequent sell-offs has added pressure to the prices, hauling in a bearish sentiment over the market.
Additionally, there are not many substantial positive liquidations or buying activity, which suggests that buyers are feeling quite uncertain while sellers are dominating the market.
Support and Resistance Levels:
According to the technical analysis, the token is currently testing a key support level at $0.050. Should this support fail prices can further dip towards the next support area at $0.046. In case the buying pressure increases the immediate resistance can be found at $0.0525, with possibilities of the token’s jump to $0.059 if the bullish momentum can hold itself.
For a shift in sentiment from bearish to bullish, breaking through these resistance levels is a must. Despite any possible upswings, looking at the current market conditions, it is more probable that the token will continue to challenge its lower support bounds before witnessing any significant upward movement.
The current price movement of Hedera is primarily driven by the bearish momentum, as indicated by both MACD and liquidity metrics. For now, investors should look out for any breakthroughs beyond the $0.0525 price point, which could suggest a trend reversal.
Also Read: South Korea Tightens Regulations on Cross-Border Crypto Transactions to Fight Crimes
Source: https://www.cryptonewsz.com/will-hedera-continue-downward-trend-key-levels/