- A potential ‘Golden Cross’ could be on the horizon for Worldcoin
- WLD’s RSI stood at 65.05, nearing overbought territory – A sign of potential caution for traders
Jacob: Worldcoin awaits a ‘Golden Cross,’ what does this mean for traders?
Worldcoin [WLD]‘s price action over the last 24 hours has been remarkable, with the crypto climbing by 12.05% to hit $2.43 at press time.
The aforementioned uptick has captured traders’ attention as the altcoin tested significant resistance zones. How the altcoin interacts with these levels could determine its short-term and long-term price direction.
An analysis of the altcoin’s price action revealed bullish signals and potential obstacles that could influence its trajectory over the next week.
Resistance levels in focus
The recent surge in Worldcoin’s price has brought it close to critical resistance levels on the charts.
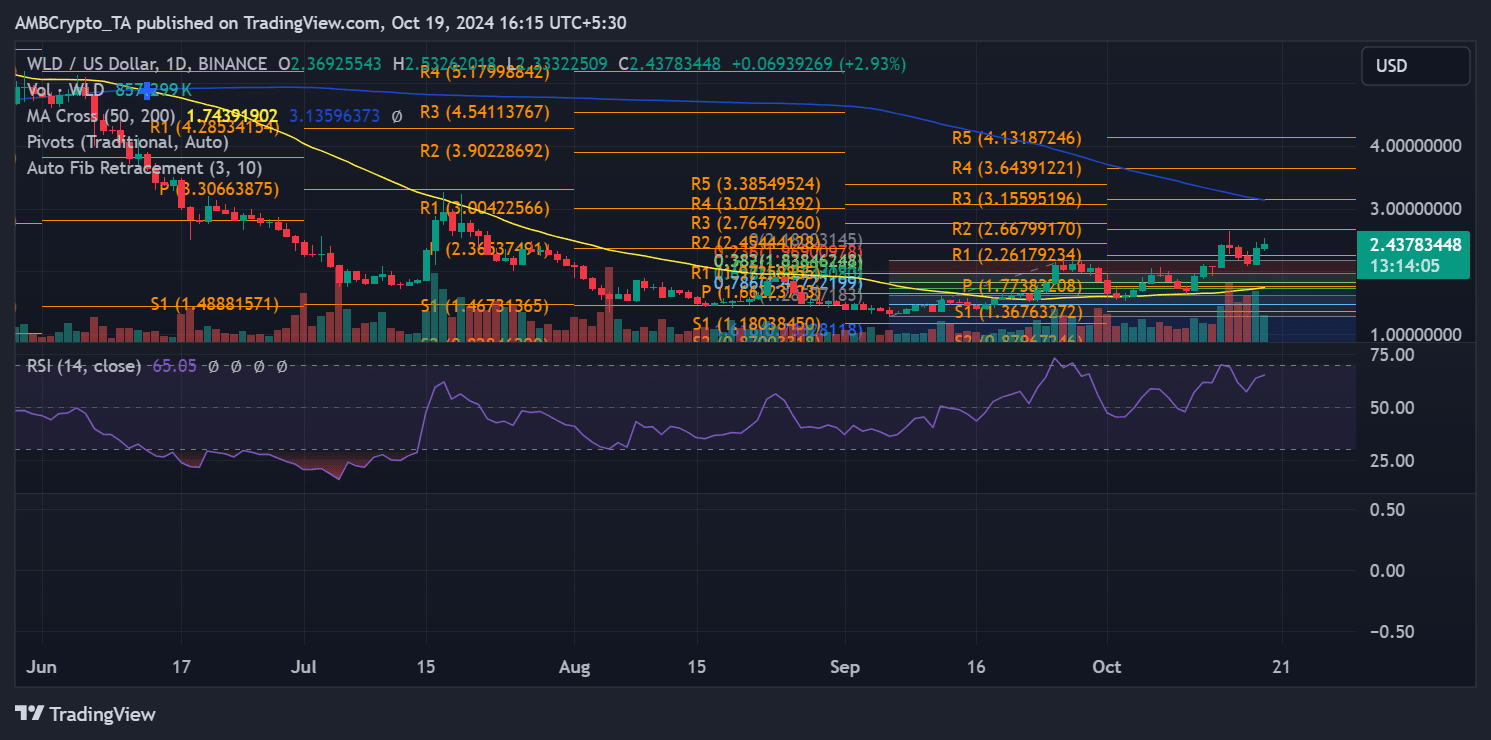

Source: TradingView
The first significant hurdle, marked by R1 ($2.5042), represents a crucial resistance level. If Worldcoin breaks above this level, it could extend its bullish momentum, potentially leading to test R2 ($2.7647) and R3 ($3.1559), where traders may look to lock in profits.
Additionally, the chart revealed a potential “Golden Cross” on the horizon as the 50-day Moving Average (MA) neared a crossover with the 200-day MA – A bullish technical pattern.
If Worldcoin surpasses the 50-day MA, placed at around $3.13 at press time, it could confirm a sustained uptrend on the charts.
However, failure to break R1 could lead to a short-term pullback or consolidation period, stalling the uptrend.
Key support levels to watch for potential pullback
In the case of a price retracement, several key support levels could act as safety nets for Worldcoin.
The first notable support level is at S1 ($1.7517), which closely aligns with a previous consolidation point. A dip to this level could indicate a healthy retracement before WLD resumes its uptrend. S2 ($1.4888) would become the next critical support level if further selling pressure arises.
This zone previously served as a base during previous price movements. And, breaching it could mean a deeper correction.
Finally, S3 ($1.1808) represented a more bearish outlook for Worldcoin in the short term.
Momentum and RSI suggest caution
The Relative Strength Index (RSI) for Worldcoin stood at 65.05, just below overbought territory. This implied that while Worldcoin has strong bullish momentum, it could exhaust it pretty soon.
Simply put, the crypto-asset could be nearing a point where buying interest begins to slow down. If the RSI climbs above 70, it would indicate an overbought condition, potentially leading to a short-term pullback or consolidation.
– Realistic or not, here’s WLD market cap in BTC’s terms
Also, Worldcoin’s price seemed to be nearing the upper boundary of its Bollinger Bands – A sign of greater volatility. Should the price become overextended, traders may need to watch for signs of a retracement.
At the time of writing, Worldcoin did seem to be riding an uptrend. However, indicators suggested there may be potential for correction soon.
Source: https://ambcrypto.com/worldcoins-12-hike-means-trader-should-watch-these-levels-now/