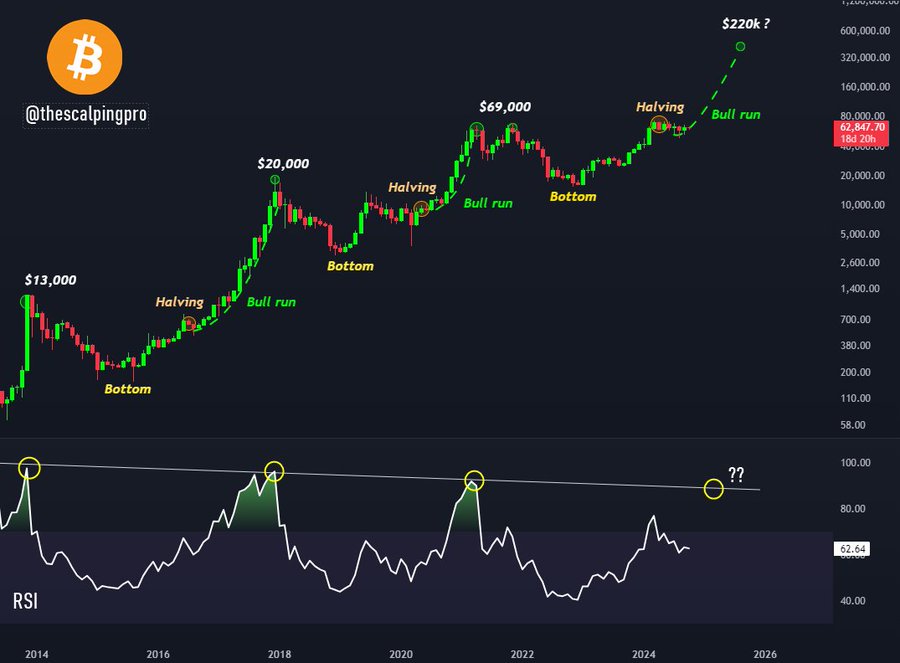
Bitcoin historical price patterns, especially as it pertains to its monthly RSI, suggest that the firstborn crypto has not yet witnessed its top for this cycle.
This is according to a recent analysis by crypto trader and market analyst Mags (@thescalpingpro). He suggested that if history repeats, Bitcoin’s price could surpass the $200K mark, citing the current position of the monthly Relative Strength Index (RSI).
The accompanying chart shared by Mags shows Bitcoin’s price movements during previous cycles. Data from the chart confirms that each of these cycles has featured halvings, bottoms, and bull runs.
Bitcoin RSI and Halving Trends
After the 2020 halving, Bitcoin reached its all-time high of $69,000 in 2021. Following that, the market experienced a significant correction, bringing the price down to around $15,000 in 2022.
However, as in past cycles, the price has steadily recovered, leading up to and following the April 2024 halving. Despite this, a major consolidation has ensued over the past few months.
https://x.com/thecryptobasic

Mags confirmed that in every market cycle, Bitcoin reaches a cycle peak when the RSI moves above 90, indicating extreme overbought conditions. This pattern has played out in each of the three halvings since 2014.
However, right now, Bitcoin’s RSI is still in the mid-60s. Mags noted that this suggests the market has more room to grow before hitting overbought levels.
This observation has bolstered confidence that Bitcoin has not yet reached its peak for the current cycle. Notably, market veterans such as Peter Brandt also hold this sentiment, citing different metrics. However, Brandt expects the top to reach $135,000.
Bitcoin’s price has been consolidating since the halving in April, with analysts like Mags expecting another bull run. If history repeats, as it often does with Bitcoin, the post-halving phase could drive prices higher, with Mags setting a target of $220,000.
Immediate Bitcoin Price Outlook
Amid the long-term bullishness, there are short-term resistance levels that Bitcoin must overcome to sustain this momentum.
A separate chart from Mags calls attention to Bitcoin’s recent price movements, focusing on a trendline that has served as resistance for over 217 days. The price has tested this trendline four times, with three previous rejections occurring.
#Bitcoin is once again testing the trendline that has acted as a strong resistance for over 217 days.
Price has faced rejection three times before, and this is the fourth attempt.
If BTC breaks through this time, we could see a new all time high very soon.🔥 pic.twitter.com/SpBy7TydMh
— Mags (@thescalpingpro) October 16, 2024
The chart shows that Bitcoin is again testing this resistance level. A breakout above this trendline could signal the start of the much-expected second phase of the bull rally, potentially pushing Bitcoin to a new all-time high (ATH).
Brandt stressed in a previous analysis that a break above $68K could set this stage for the upcoming rally. As the RSI continues to climb, the possibility of hitting $220,000 becomes more likely. However, Bitcoin must first conquer its immediate hurdles, as it currently changes hands at $67,553, up 6.72% this month.
DisClamier: This content is informational and should not be considered financial advice. The views expressed in this article may include the author’s personal opinions and do not reflect The Crypto Basic opinion. Readers are encouraged to do thorough research before making any investment decisions. The Crypto Basic is not responsible for any financial losses.
Source: https://thecryptobasic.com/2024/10/16/bitcoin-eyes-220k-as-rsi-data-suggests-cycle-top-not-yet-in/?utm_source=rss&utm_medium=rss&utm_campaign=bitcoin-eyes-220k-as-rsi-data-suggests-cycle-top-not-yet-in
