MicroStrategy Inc (NASDAQ: MSTR) is one of the best-performing stocks in 2024 as of mid-October.
At the beginning of the year, MSTR’s stock price was $68.52. At press time, MicroStrategy shares are trading at $202.44 — having rallied by 50% over the last 30 days to bring year-to-date (YTD) returns up to 196.01%.
The most recent upswing saw the company’s stock price rise from $196.40 to $212 following the October 11 announcement of plans to become ‘the world’s first Bitcoin (BTC) bank’.
However, the stock saw a sudden 7.58% drop on October 14 — and some technical analysts are cautioning that the stock could soon see an even more significant correction to the downside.

Bearish chart pattern and divergences on MSTR stock chart
In a TradingView post on October 14, cryptocurrency researcher and analyst Alan Santana shared a chart outlining MSTR’s price action since the beginning of the year.
Santana noticed a couple of interesting factors — while stock prices reached an all-time high on October 14, as soon as that happened, a huge red candle was printed, indicating that traders and investors pulled back from this price point.
While a slightly bearish sign, on its own, this would not be reason enough to cause concern. That being said, Santana’s call for caution wasn’t caused by this alone — there are currently three bearish divergences in play.
Looking at the latest parabolic bullish moves prior to the current surge, which started on September 9, reveals a discrepancy in volume.
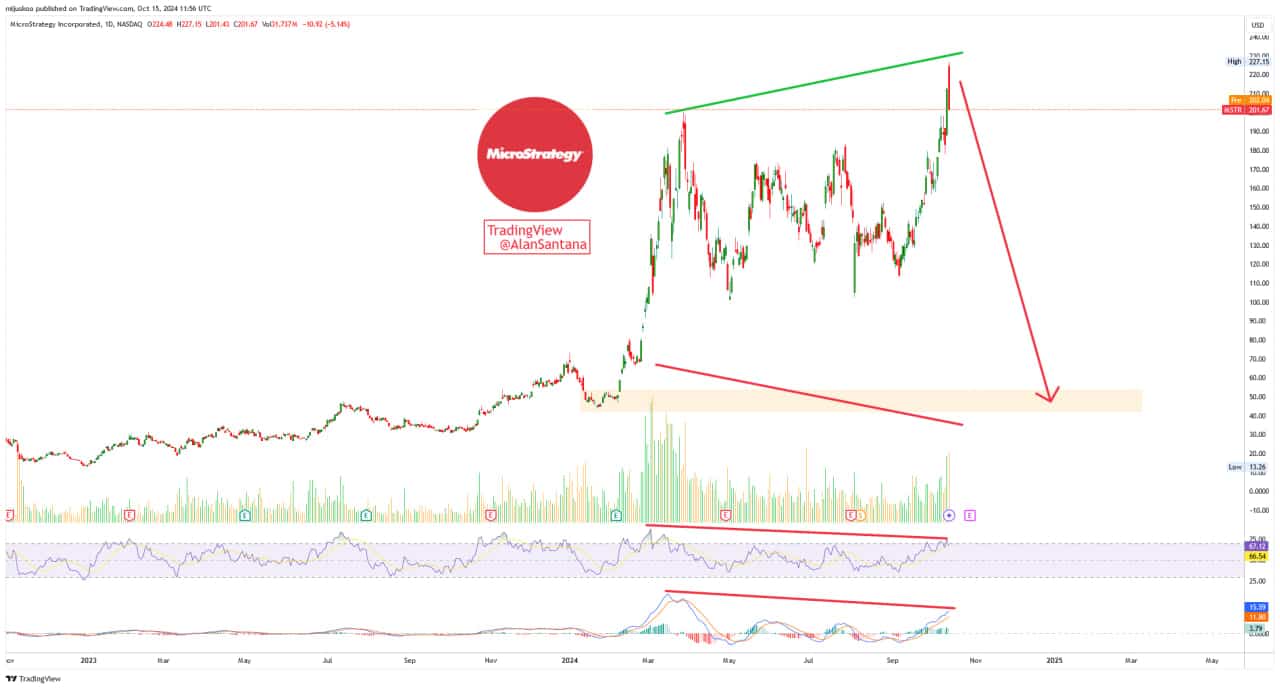
It appears that the current upswing is happening with only half the volume of the last one — while stock prices are reaching higher highs, there’s a bearish divergence at work.
In addition, the same divergence is seen with two key technical indicators — the relative strength index (RSI) and moving average convergence/divergence (MACD) — both of which show lower highs relative to the prior price surge.
Will MSTR stock crash?
While Santana’s analysis outlines a drop to as low as approximately $53, a move that would see the stock lose almost all of its YTD gains and revert to similar levels as before the initial February surge, valid counterarguments exist.
For one, MSTR stock price is closely tied to Bitcoin — per Bitcoin Treasuries, the business is the largest public company in terms of BTC holdings, having 252,220 coins worth a combined total of $40,861,960 at press time, up from 244,800 BTC on September 13.
MicroStrategy has consistently been purchasing the cryptocurrency, with the exception of a notable pause in September. The leading cryptocurrency accounts for 40.40% of MSTR’s market cap — it’s impossible to separate the stock price from the value of BTC, rendering conclusions based solely on technical analysis less valid.
Of course, if the price of Bitcoin drops, so too will the stock price of MSTR — but the extent of its reserves and the recent institutional adoption in the form of Bitcoin ETFs offer a counterbalance that could shield the company from the worst should that come to pass.
The crypto-centric enterprise is uniquely positioned to benefit from future bull cycles — and while profit-taking is almost certainly occurring and a pullback is in the works, it’s unlikely that it will be as severe as Santana predicts.
Source: https://finbold.com/why-microstrategy-could-see-stock-price-plummet/