- BONK’s symmetrical triangle suggested a breakout, with potential for a major bullish wave.
- Volume and Open Interest surged as traders positioned themselves for a possible price explosion.
Bonk [BONK] was consolidating within a tight range, on the verge of a breakout at press time. The price has been following a symmetrical triangle pattern, a signal that typically suggests an imminent move.
Analyst World of Charts predicted that if a breakout occurs, it could lead to a bullish wave in the coming weeks. Notably, BONK was approaching the apex of the triangle, indicating that the breakout may happen soon.
World of Charts also highlighted the potential for a breakout based on the symmetrical triangle pattern. This chart formation often leads to price movements, as the consolidation occurs before decisive moves in either direction.
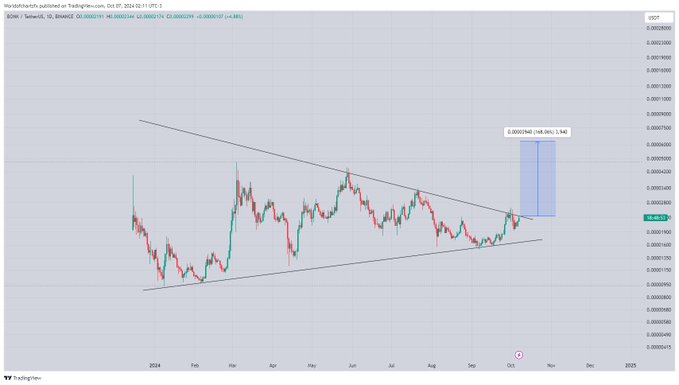

Source: X
For BONK, the consolidation within the triangle has been ongoing for several months.
With the price nearing the triangle’s apex, traders and analysts alike are watching for a possible breakout, which could send prices upward soon.
Technical indicators signal bearish momentum
Looking at BONK on the 4-hour chart, the price was holding above the key support level of $0.00002107 at press time.
The 50-period and 100-period EMAs were acting as dynamic supports, but the price has recently tested the 50 EMA, suggesting the possibility of further consolidation.
Should the price break below the 100 EMA at $0.00002108, it could signal downside pressure in the short term.
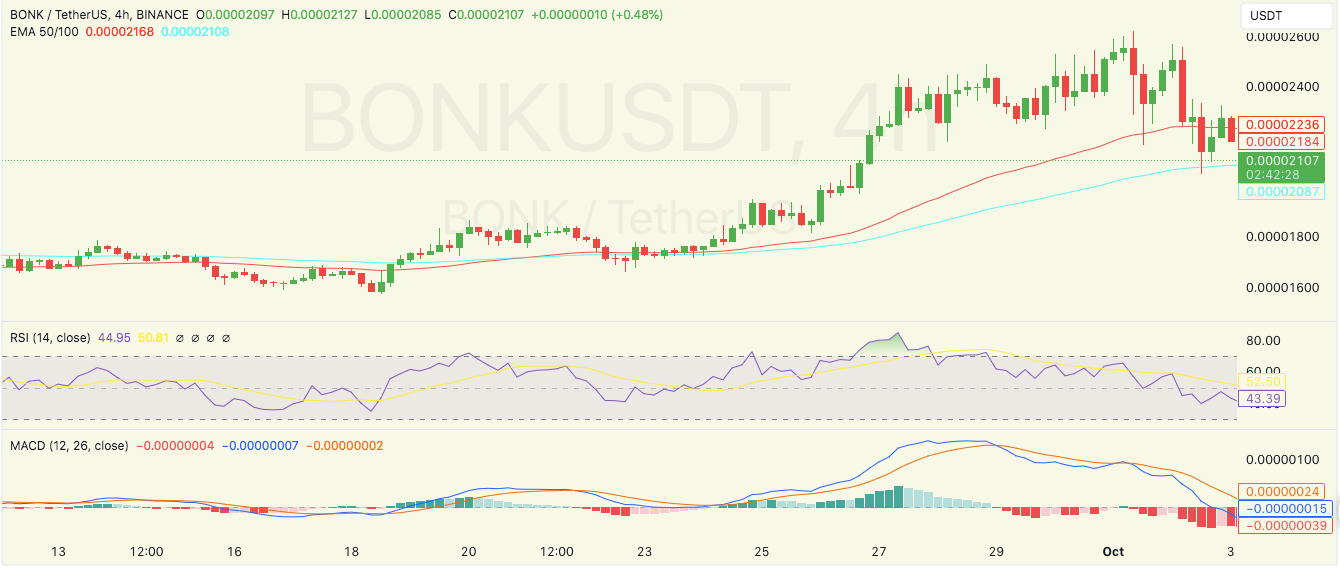

Source: TradingView
The Relative Strength Index (RSI) was hovering around 44.95, showing that BONK was approaching oversold conditions.
A recovery in the RSI above 50 could indicate renewed buying pressure, though the current downward trend suggested that the price may continue consolidating.
Additionally, the Moving Average Convergence Divergence (MACD) on the 4-hour chart showed a bearish crossover, reinforcing the potential for a bearish trend unless the price can regain momentum.
BONK: current market performance
As of press time, Bonk’s price was $0.00002124, after a decline of 6.31% in the last 24 hours and 15.59% in the past seven days. With a circulating supply of 69 trillion tokens, $BONK’s market cap was $1.47 billion.
Despite the short-term price decline, World of Charts remained optimistic about the potential for a breakout, provided key support levels hold.
Read Bonk’s [BONK] Price Prediction 2024–2025
Recent data from Coinglass revealed an increase in both trading volume and Open Interest for the memecoin. Volume has risen by 5.58% to $91.07 million, while Open Interest surged 1.57% to $9.94 million.
These indicators suggested that traders were positioning themselves in anticipation of a potential breakout.
Source: https://ambcrypto.com/bonks-massive-breakout-analyst-predicts-bullish-wave-ahead/