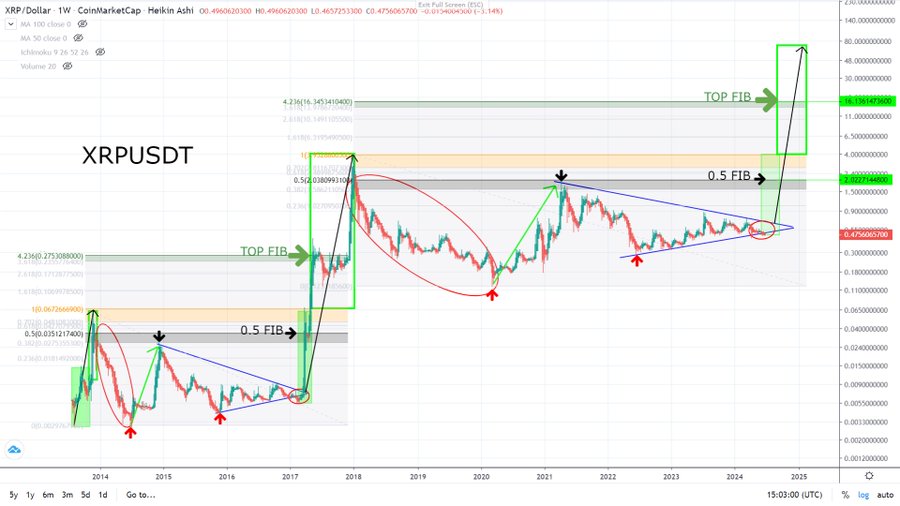
Notable market analyst Lud recently shared a fractal-based analysis suggesting XRP could replicate its price trajectory from 2017.
In his initial analysis shared in June this year, Lud identified a repeating fractal from XRP’s 2017 price action, indicating the cryptocurrency might follow a similar trajectory in 2024.
Initial Analysis: XRP Trails 2017 Movements
The chart shows XRP’s price history from 2014, calling attention to an important consolidation period where prices flattened and formed symmetrical triangles. These patterns, which featured lower lows and the lower highs, suggested then that XRP was preparing for a breakout.
The analyst leveraged Fibonacci retracement levels, which helped him pinpoint important support and resistance zones. Notably, the 0.5 Fibonacci (FIB) level was very crucial in 2017, where XRP’s price faced strong resistance before a breakout.

Lud’s chart shows that XRP started forming a similar triangle pattern in the current market cycle leading up to July 2024, with the price struggling to break through key resistance points around the 0.5 Fibonacci line.
The 2017 fractal shows a parabolic move from the 0.5 Fibonacci level, catapulting XRP from under $0.50 to a high near $3.50. This marked XRP’s all-time high, with the altcoin unable to surpass the level during the 2021 bull run due to regulatory challenges.
However, with XRP now declared a non-security, Lud projected in July that if XRP follows this historical fractal, it could achieve a breakout that would see the altcoin rise to $16, a level he highlighted in the upper section of the chart.
XRP Continues to Follow the Fractal
Most recently, Lud presented an updated analysis, suggesting that XRP continues to follow the fractal laid out earlier. Despite price fluctuations, including a brief “shakeout” (a drop designed to push weak hands out of the market), XRP’s movement still fits within the historical pattern from 2017.
#XRPUSDT ON THE 3 DAY TIMEFRAME.
STILL FOLLOWS THE FRACTAL#XRPCommunity $xrp https://t.co/qbqfEXKLtm pic.twitter.com/5cuDssQvvO— LUDXRPFLR🇳🇱☀️⚡ (@ludnlxrp) October 3, 2024
The updated analysis shows recent price action, indicating that XRP has remained within a range, exhibiting consolidation around $0.50 and showing resilience in holding key support levels. One of those support levels is the $0.52 region, which XRP upheld amid the latest drop following the SEC’s appeal notice.
The updated chart shows a red box displaying a lateral movement which depicts the fractal’s consolidation phase just before the breakout in 2017. Lud sees this as a critical period, where XRP is likely building momentum for its next big move. At press time, XRP trades for $0.5287.
Disclaimer: This content is informational and should not be considered financial advice. The views expressed in this article may include the author’s personal opinions and do not reflect The Crypto Basic’s opinion. Readers are encouraged to do thorough research before making any investment decisions. The Crypto Basic is not responsible for any financial losses.
Source: https://thecryptobasic.com/2024/10/05/xrp-continues-to-follow-2017-fractal-with-target-exceeding-16/?utm_source=rss&utm_medium=rss&utm_campaign=xrp-continues-to-follow-2017-fractal-with-target-exceeding-16