- Buying pressure on the token increased in the last few days.
- A technical indicator, however, hinted at a price correction first.
XRP bulls have been pushing hard over the last few days, allowing the token to break above a crucial resistance. This latest breakout could be a gamechanger for XRP, as it might be getting ready for a nearly 300% price rise in the coming days.
XRP’s successful breakout
After remaining bearish throughout the last week, the token recently gained bullish momentum and pushed its price up by more than 2% in the last 24 hours.
At the time of writing, the token was trading at $0.6133 with a market capitalization of over $34.6 billion.
Things can get even better in the coming days, as the recent price uptick allowed it to break above a bull pattern. Captain Faibik, a popular crypto analyst, recently posted a tweet revealing a multi-year bullish symmetrical triangle pattern.
The pattern first emerged in 2021, and since then XRP’s price has been consolidating inside it. Its recent price uptick allowed XRP to breakout.
Captain Faibik’s tweet also suggested that this latest development could result in XRP registering a nearly 300% price hike in the coming weeks or months.
However, since the 300% target seemed a bit too ambitious in the near term, the tweet also mentioned that the midterm target could be $2.3.

Source: X
How soon can XRP touch $2.3?
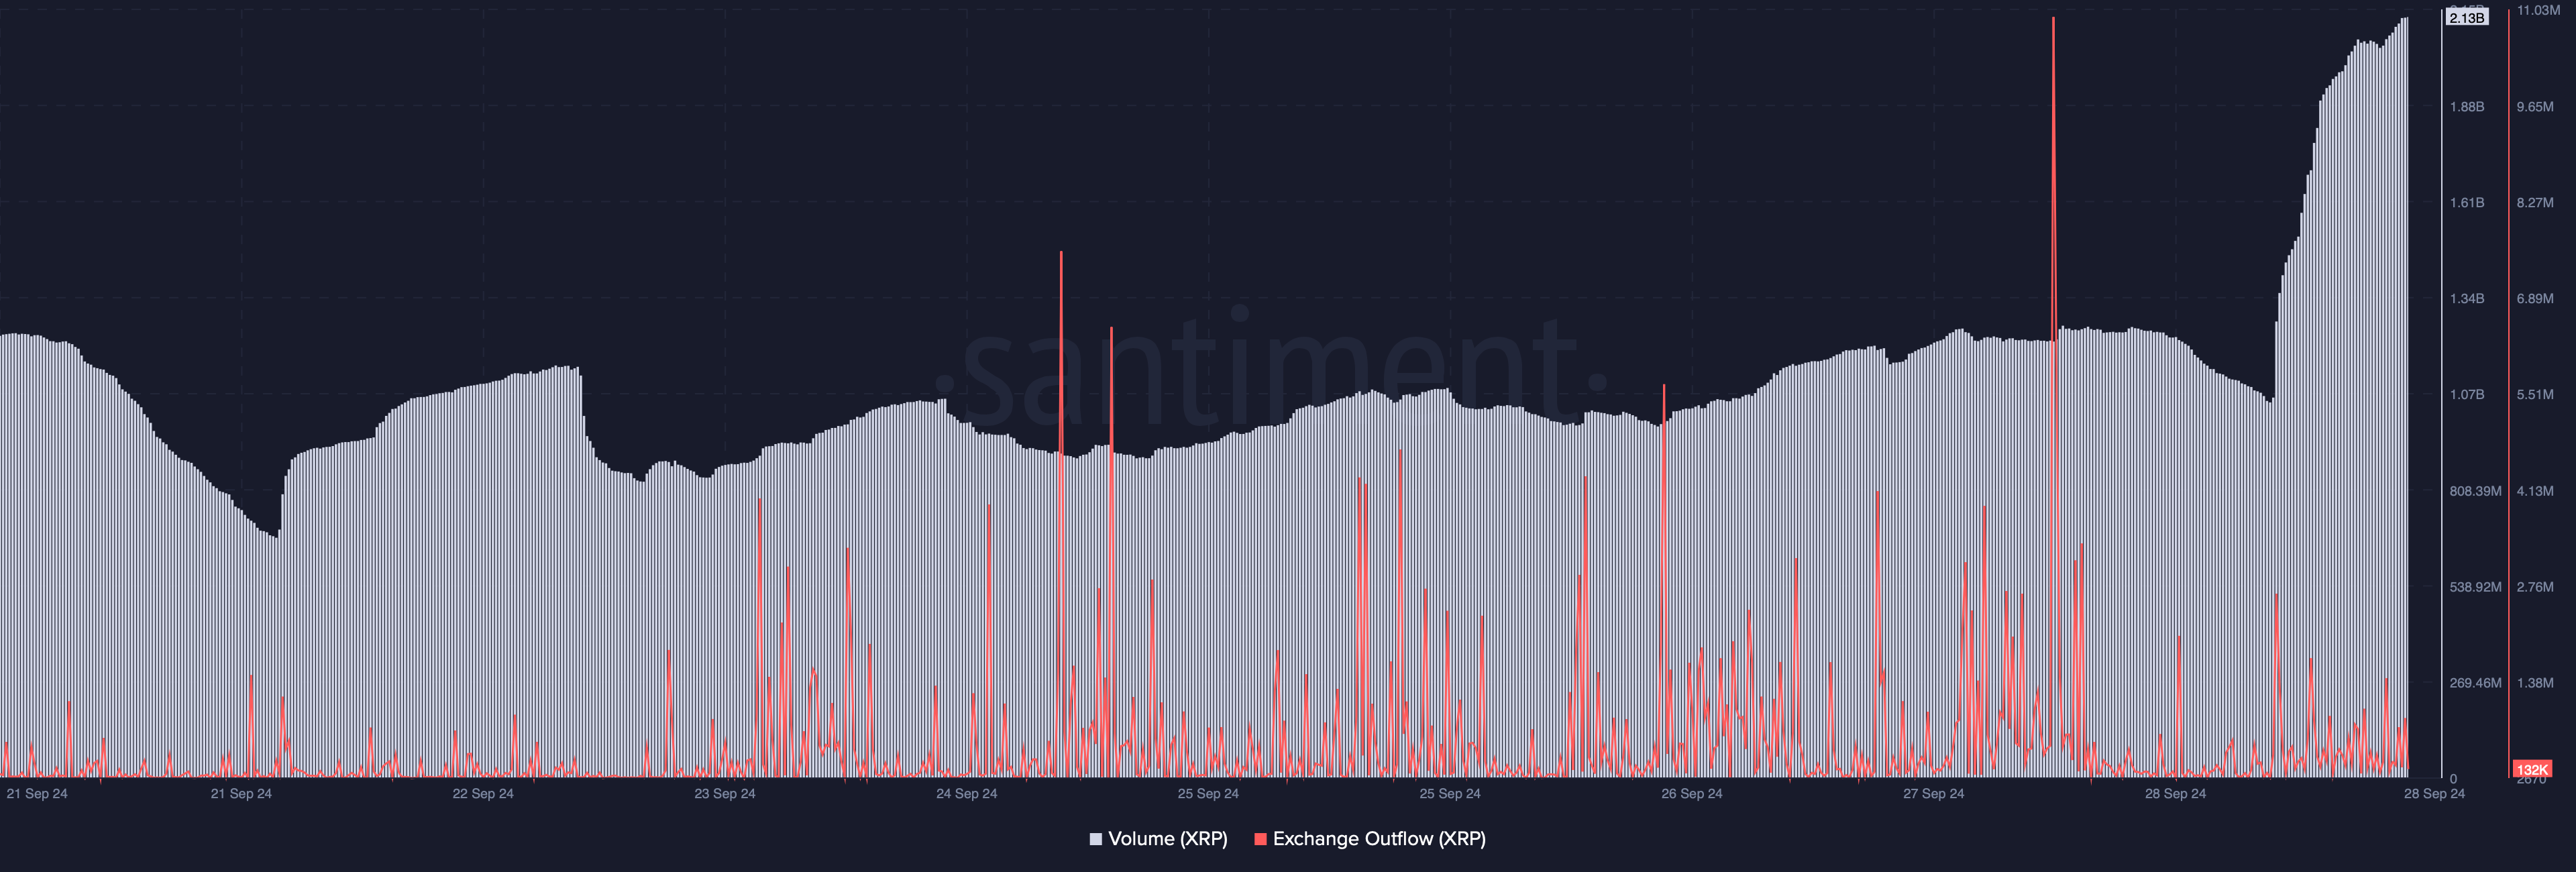
AMBCrypto then checked XRP’s on-chain data to find out the odds of it touching $2.3 in the coming days. As per our analysis of Santiment’s data, the token’s trading volume increased sharply along with its price.
Whenever this happens, it indicates that the chances of the on-going bullish price trend continuing are high.
In fact, investors were also confident in the token. This was evident from the spike in XRP’s exchange outflow, meaning that buying pressure on it was high. Generally, high buying pressure results in price upticks.


Source: Santiment
However, whales’ exposure in the market declined in the past 24 hours.
AMBCrypto’s look at Hyblock Capital’s data revealed that XRP’s whale vs. retail delta fell from more than 90 to 81, indicating that retail investors were increasing their exposure in the market compared to whales.

Source: Hyblock Capital
Is your portfolio green? Check the Ripple Profit Calculator
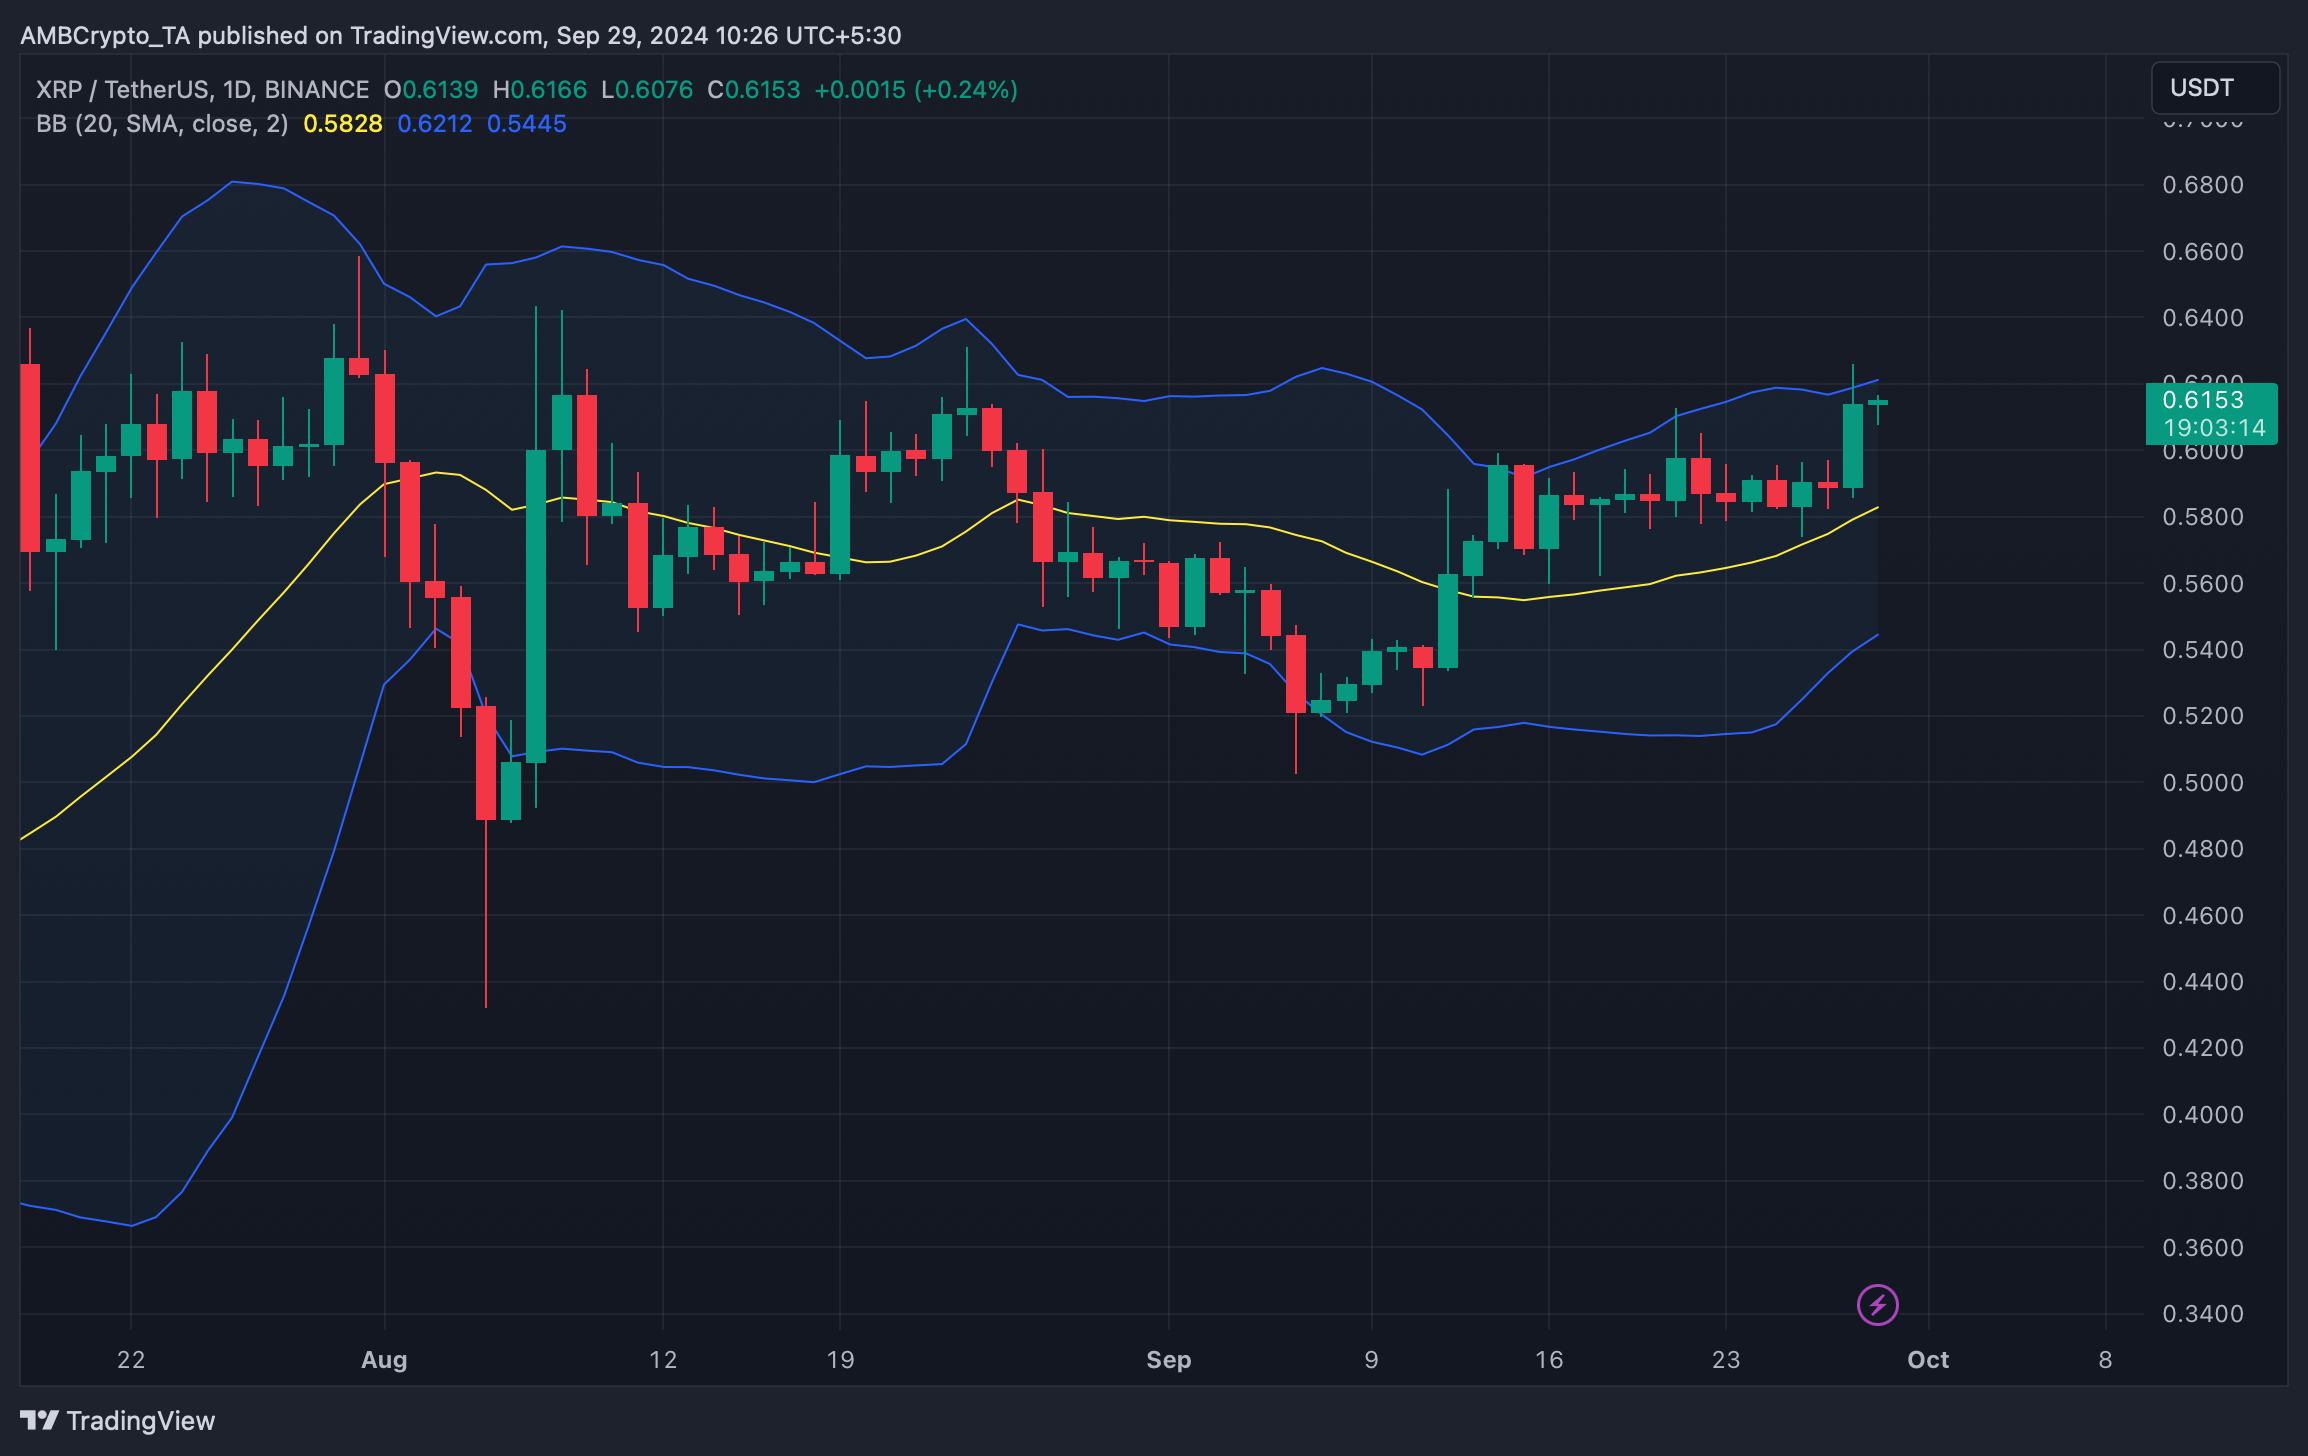
AMBCrypto then checked the token’s daily chart to better understand whether this bull rally will continue further. XRP’s price had touched the upper limit of the Bollinger Bands, which often results in price corrections.
If that happens, then XRP might drop to its support near its 20-day simple moving average (SMA).


Source: TradingView
Source: https://ambcrypto.com/xrp-breaks-this-pattern-aims-for-300-price-jump/