PEPE is approaching a pivotal moment as it tests the $0.00001152 level, a critical junction that could shape its next direction. A breakout above this key resistance may spark renewed bullish momentum, driving the price higher. However, failure to surpass this level could lead to a rejection, potentially pushing the meme coin into a retracement phase.
As traders focus on this pivotal resistance, this analysis will explore the likelihood of a breakout versus a potential rejection by analyzing PEPE’s current price action as it approaches the critical $0.00001152 resistance level. Key technical indicators, market sentiment, and trading volume will be examined to provide a clearer outlook on its next move.
PEPE Current Price Action
Currently, despite trading above the 100-day Simple Moving Average (SMA), PEPE’s price on the 4-hour chart is showing signs of a potential rejection. After reaching the key resistance level of $0.00001152, the price has begun to decline, signaling that positive movement may be weakening and a deeper retracement may occur if the meme coin fails to regain upward momentum soon.
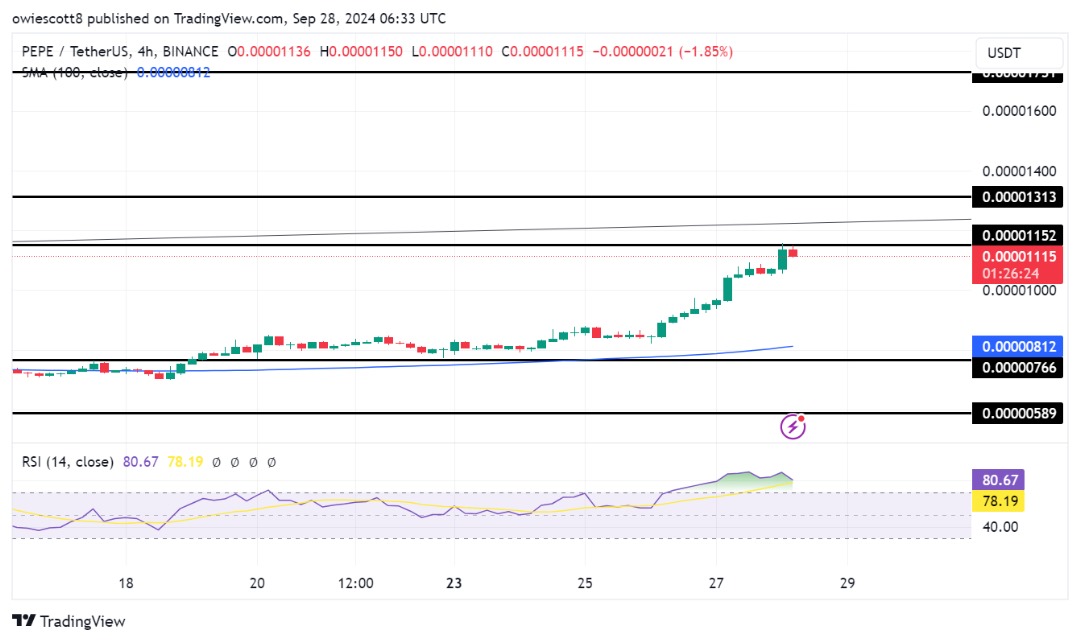
Also, the Relative Strength Index (RSI) has dropped to 82% after peaking at 88%, indicating a cooling off in buying pressure. Although the RSI remains in overbought territory, this decline suggests that bullish momentum may be fading. Such a drop typically signals that the asset could be entering a consolidation phase or experiencing a potential price retracement, especially if the asset struggles to break through key resistance levels.
On the daily chart, the crypto asset has shown strong upward movement with multiple bullish candlesticks forming after breaking above the 100-day SMA. However, the current candlestick reveals a rejection wick, signaling mounting selling pressure. If this rejection persists, it may indicate weakening bullish strength, potentially leading to consolidation or a deeper retracement as traders take profits.
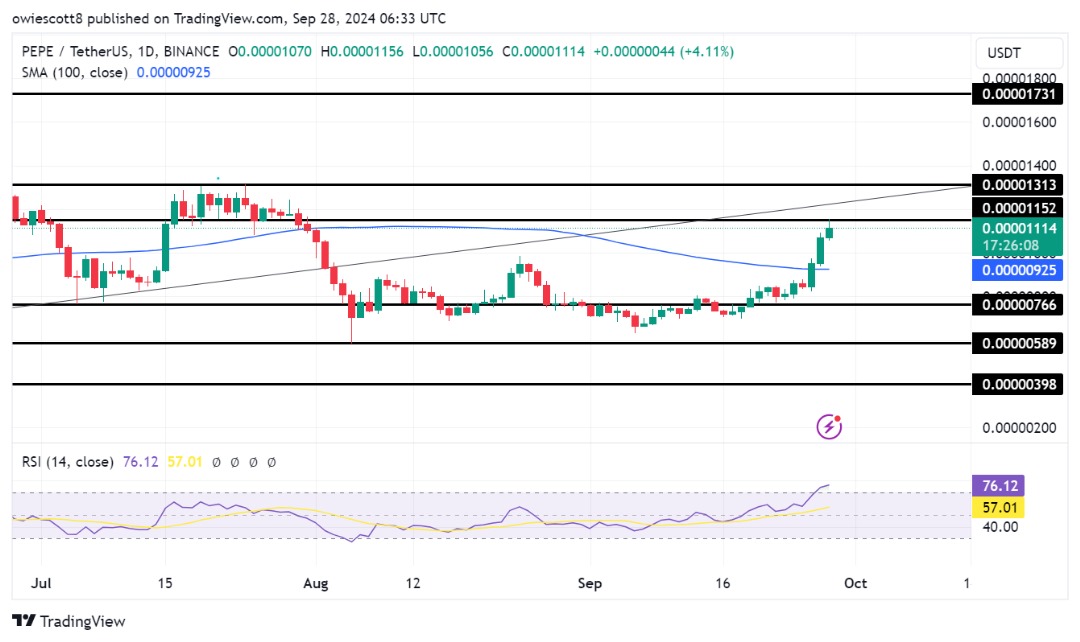
Finally, on the 1-day chart, the RSI has risen above 50% and is now at 75%, reflecting strong optimistic sentiment and dominant buying pressure. While this suggests continued price increases, the proximity to overbought territory raises the possibility of a pullback if buying weakens. A further rise could strengthen the uptrend, but a decline may indicate an upcoming correction or consolidation.
Market Sentiment Divided: What’s Next For The Meme Coin?
PEPE’s recent price action has left the market divided, with traders speculating between optimism for a breakout and caution about a potential rejection. Should the meme coin face a rejection, it may start to retrace towards the $0.00000766 level and potentially lower support levels.
However, A successful breakout above the $0.00001152 resistance level could indicate heightened buying momentum, possibly setting the stage for further gains and targeting higher resistance levels, such as $0.00001731 and beyond.

Featured image from iStock, chart from Tradingview.com
Source: https://bitcoinist.com/pepe-reaches-critical-junction/