Este artículo también está disponible en español.
Bitcoin has experienced a significant price surge since Tuesday, following the Federal Reserve’s announcement of a 50 bps interest rate cut. This move pushed BTC past the critical $62,000 mark, a psychological level that has become a turning point for investor sentiment. With Bitcoin now testing local supply, market participants are closely watching for further upside potential.
Related Reading
As the price continues to push higher, analysts are pointing to crucial data indicating a potential shift in Bitcoin’s trend after months of downtrend price action. Glassnode metrics reveal a notable trend change, suggesting BTC may be entering bullish territory once again. This resurgence is drawing increased attention from both retail and institutional investors as they evaluate whether Bitcoin’s rally has staying power or if the market will face resistance at higher levels.
With renewed momentum, the coming days will be critical in determining if Bitcoin can sustain this upward trajectory and fully break out of its previous bearish phase.
Bitcoin Signals A Bullish Return
Bitcoin investors have seen sentiment shift dramatically from fearful to hopeful in just a few days. Following the Federal Reserve’s rate cut announcement on Wednesday, Bitcoin surged over 8%, breaking critical levels and testing local supply. This sudden price action has sparked renewed optimism in the broader crypto market, giving investors hope for a fresh start after months of bearish price movement.
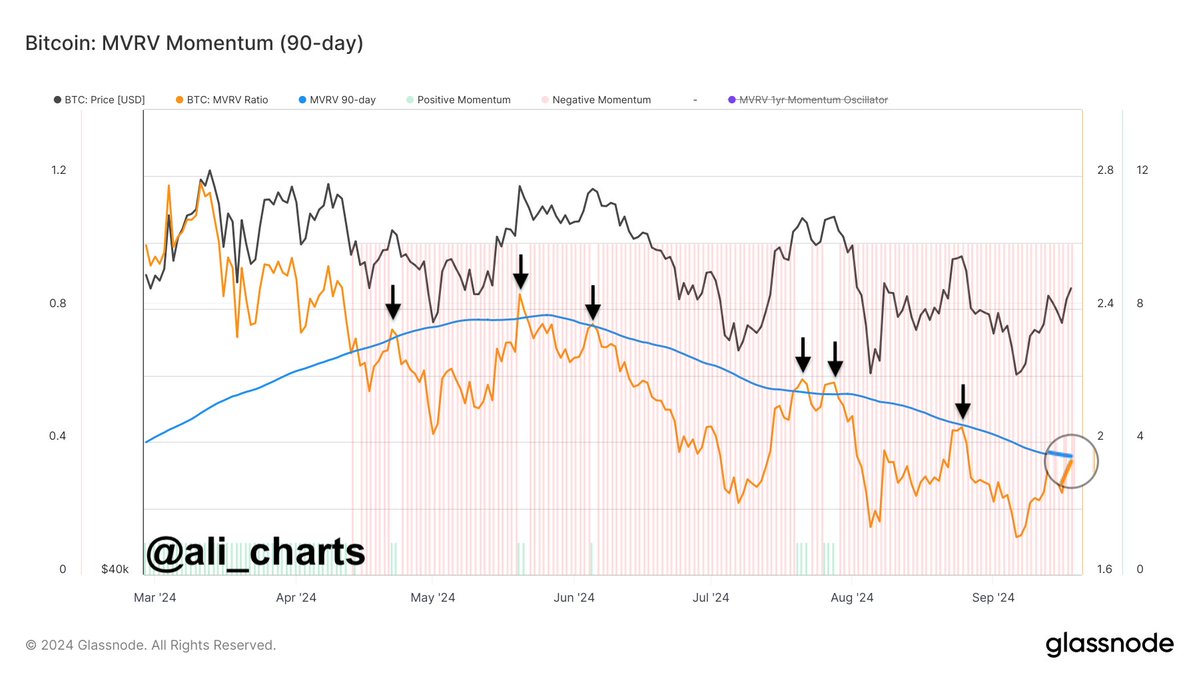
Prominent crypto analyst Ali Martinez has shared valuable insights on X, drawing attention to key data from Glassnode that suggests a significant shift in Bitcoin’s price trend. Specifically, Ali highlights the Market Value to Realized Value (MVRV) ratio, which tracks the difference between BTC’s market price and its actual value.

The MVRV ratio, which had been in a downtrend since April, is now rising, signaling that Bitcoin may be regaining strength. Ali notes that the MVRV is a critical indicator for assessing momentum, and the current upward trend hints at a potential return to bullish territory.
Related Reading
The analyst further explains that if the MVRV can close above its 90-day moving average, it would confirm a stronger bullish outlook for Bitcoin. Given the aggressive price surge and the increasing demand reflected in recent price action, this scenario seems increasingly likely. Investors are now watching closely, as Bitcoin’s next moves could mark the beginning of a new bull phase.
Technical Levels To Watch
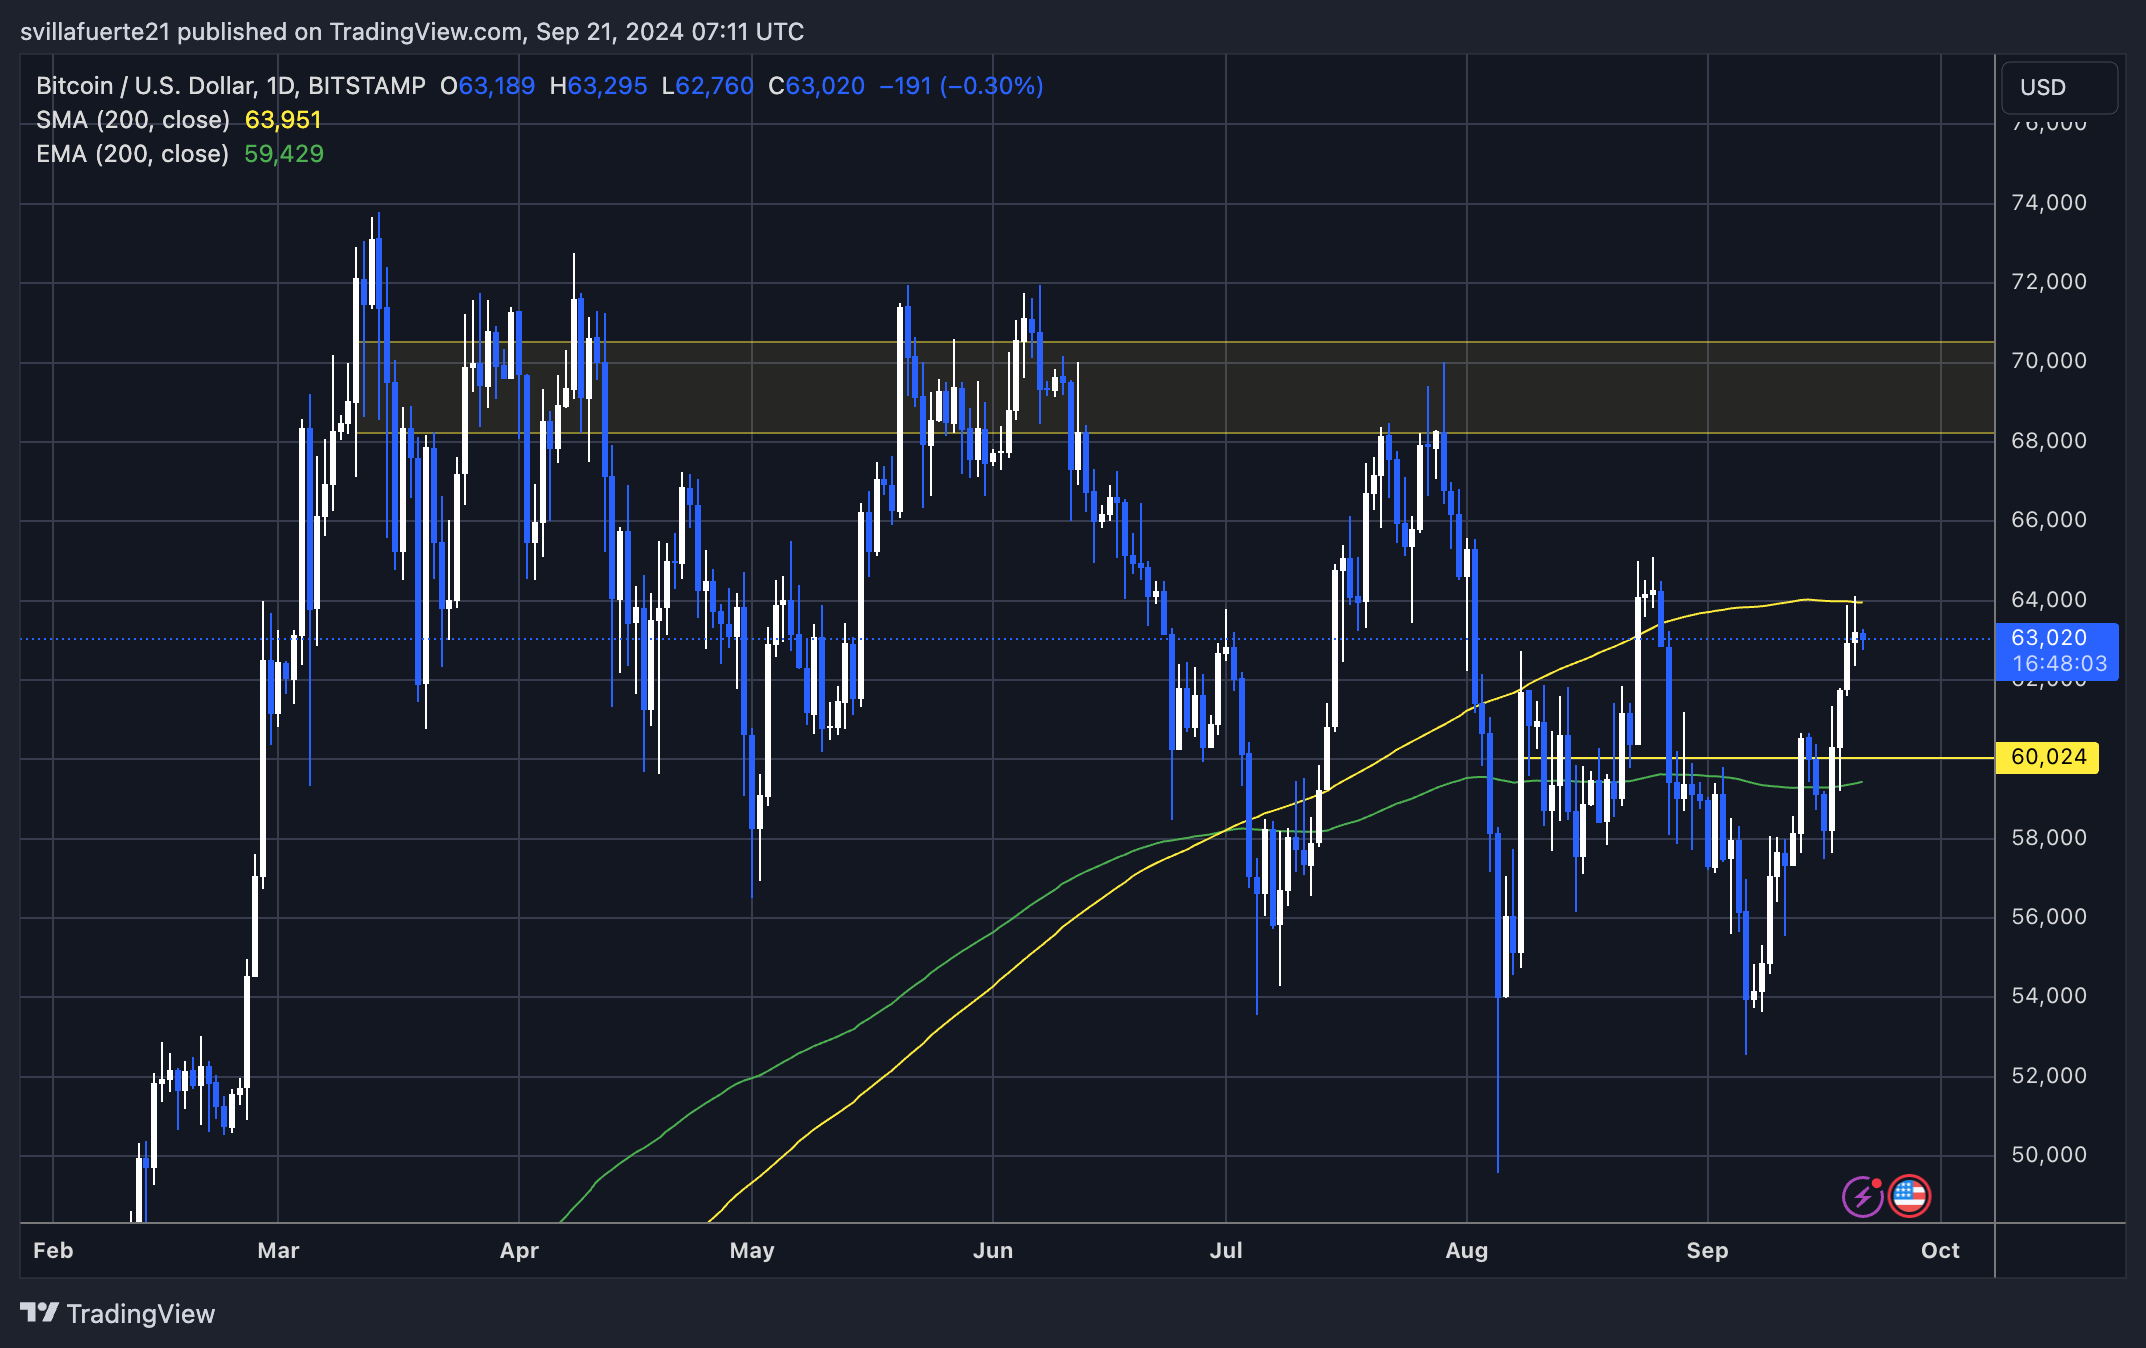
Bitcoin (BTC) is trading at $63,024 after days of consistent “only up” price action since hitting local lows. The price recently broke above the daily 200 exponential moving average (EMA) at $59,350 and is now testing the critical daily 200 moving average (MA) at $63,954.

This daily 200 MA is a key long-term indicator, signaling overall market strength. If Bitcoin can reclaim this level as support, it would likely trigger a significant price surge, bolstering the bullish outlook.
Related Reading
For bulls to maintain momentum, the next target would be around this critical level, with a potential push toward $65,000, a price last tested in late August. However, should BTC fail to hold above $60,000 in the coming days, investors may see a retracement to lower demand levels. The ability to stay above key support zones will determine the next phase of price action.
Featured image from Dall-E, chart from TradingView
Source: https://www.newsbtc.com/news/bitcoin-indicator-signals-shift-to-bullish-territory-can-btc-break-past-65000/