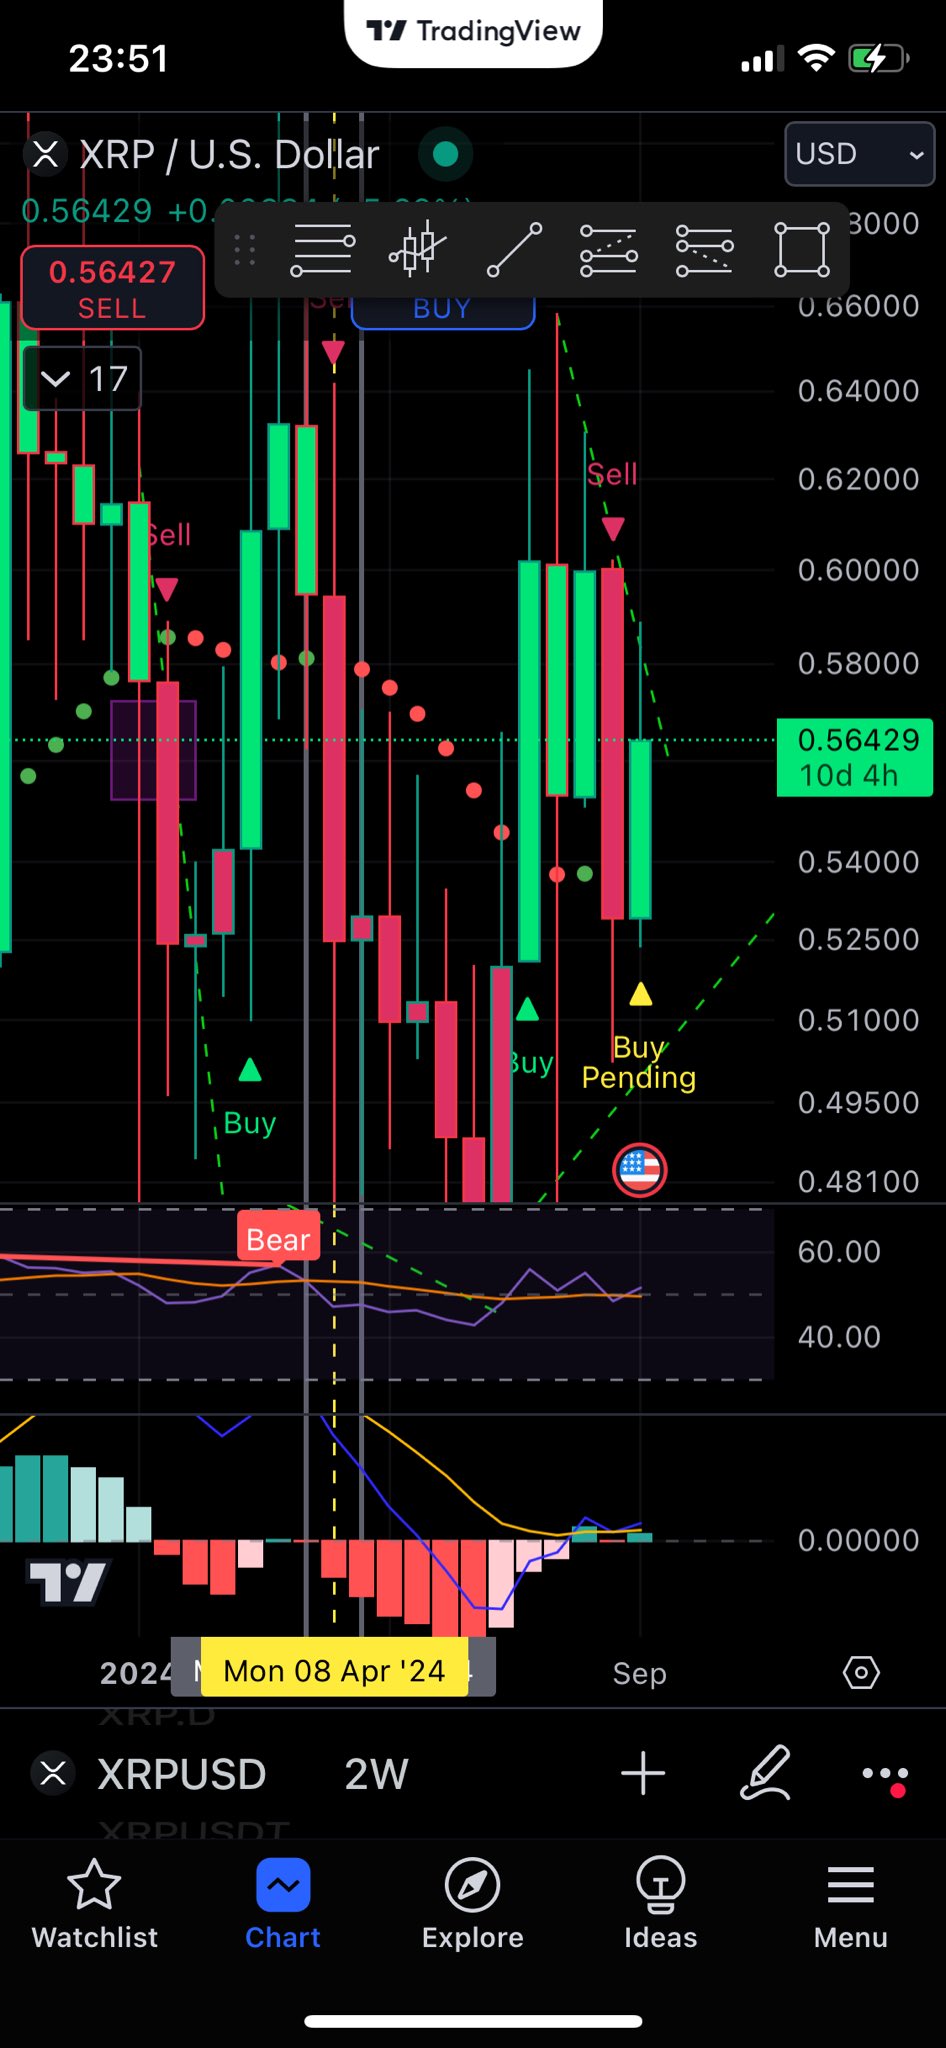
A prominent market analyst shares several XRP charts across multiple timeframes that suggest a bullish trend might be on the horizon.
Using the Sharp Shooter Candles indicator, the analyst noted that XRP has already signaled a buy on the 8-hour chart, with a “buy pending” on longer time frames, including the 1-day, 2-day, and up to the 3-week chart.
Specifically, on the 3-week chart, this “buy pending” signal reveals XRP’s bullish tendency over the long-term. Notably, it indicates that while XRP has not fully confirmed a breakout, key indicators suggest that it could be primed for a major move upward.
The 3-Week Chart
At the time of the analysis, XRP changed hands at $0.5642, hovering above the psychological support level at $0.50 on the 3-week time frame.
The buy pending signal in this time frame suggests that the market is watching for a decisive upward move, which may be triggered if XRP breaks through the first major psychologically important resistance level at $0.60.

Beyond this point, the next critical roadblock to breach is around $0.62. If the price successfully breaks above this area, the long-term target sits near $0.70. Interestingly, this area has acted as a strong barrier for XRP following its collapse in March.
Notably, the market has yet to fully commit to an upward move. With XRP currently sitting just below the $0.57 mark, crossing this threshold could validate the buy pending signal, paving the way for a rally toward $0.60.
However, if XRP fails to break through these resistance levels, it could retest the support at $0.50. A fall below this would bring $0.48 into play. Nonetheless, given the strength of the buying signals, this scenario seems less likely unless broader market conditions deteriorate.
Responding to the analysis, market watcher Jesse Olson echoed the “probably nothing” mantra. However, he further charged that there is “definitely something” brewing for XRP within these charts.
Probably nothing but definitely something $XRP https://t.co/1GZzYWE3uW
— Jesse Olson (@JesseOlson) September 12, 2024
XRP Short-Term Outlook
Meanwhile, in the near term, XRP’s price has climbed to $0.5705 at the time of writing. The Ichimoku Cloud indicator shows that the price is battling the upper limits of the cloud, a region that typically represents uncertainty or consolidation.
XRP has touched the cloud’s top boundary, which sits around $0.57, and if the price closes above this level, it could confirm the start of a bullish trend. The next resistance above the cloud lies near $0.60, as revealed by the 3-week chart.
The Stochastic RSI is currently deep in the overbought territory, with a value of 82.81, while the signal line is at 70.26. As a result, XRP might experience a short-term pullback before continuing its upward trajectory.
However, it’s worth noting that overbought conditions can persist in strong uptrends, meaning XRP could still have more room to run before any significant correction occurs. A key support level to watch is $0.55, which could act as a pullback zone should XRP face short-term resistance.
Disclaimer: This content is informational and should not be considered financial advice. The views expressed in this article may include the author’s personal opinions and do not reflect The Crypto Basic’s opinion. Readers are encouraged to do thorough research before making any investment decisions. The Crypto Basic is not responsible for any financial losses.
Source: https://thecryptobasic.com/2024/09/14/top-analyst-says-these-xrp-charts-have-definitely-something-for-xrp/?utm_source=rss&utm_medium=rss&utm_campaign=top-analyst-says-these-xrp-charts-have-definitely-something-for-xrp