A recent technical analysis of XRP by Cointelegraph has sparked conversations about the value of the asset advancing toward $4.2
The analysis indicated that while the broader cryptocurrency market has seen significant growth in 2024, XRP has lagged. Indeed, Bitcoin and BNB have maintained over 30% gains year-to-date, while XRP has plummeted over 15% during the same time.
However, a closer look at XRP’s technical indicators reveals a promising trend. It suggests a potential turnaround in fortunes and a possible major price surge on the horizon for XRP.
Inverse Head and Shoulders Pattern Signals XRP Rally to $1
On the weekly chart, XRP appears to be forming a classic Inverse Head and Shoulders (IH&S) pattern, a well-known bullish reversal indicator. The left shoulder formed between May and December 2022, the head (or low point) in June 2023, and the right shoulder has been developing since August 2024.
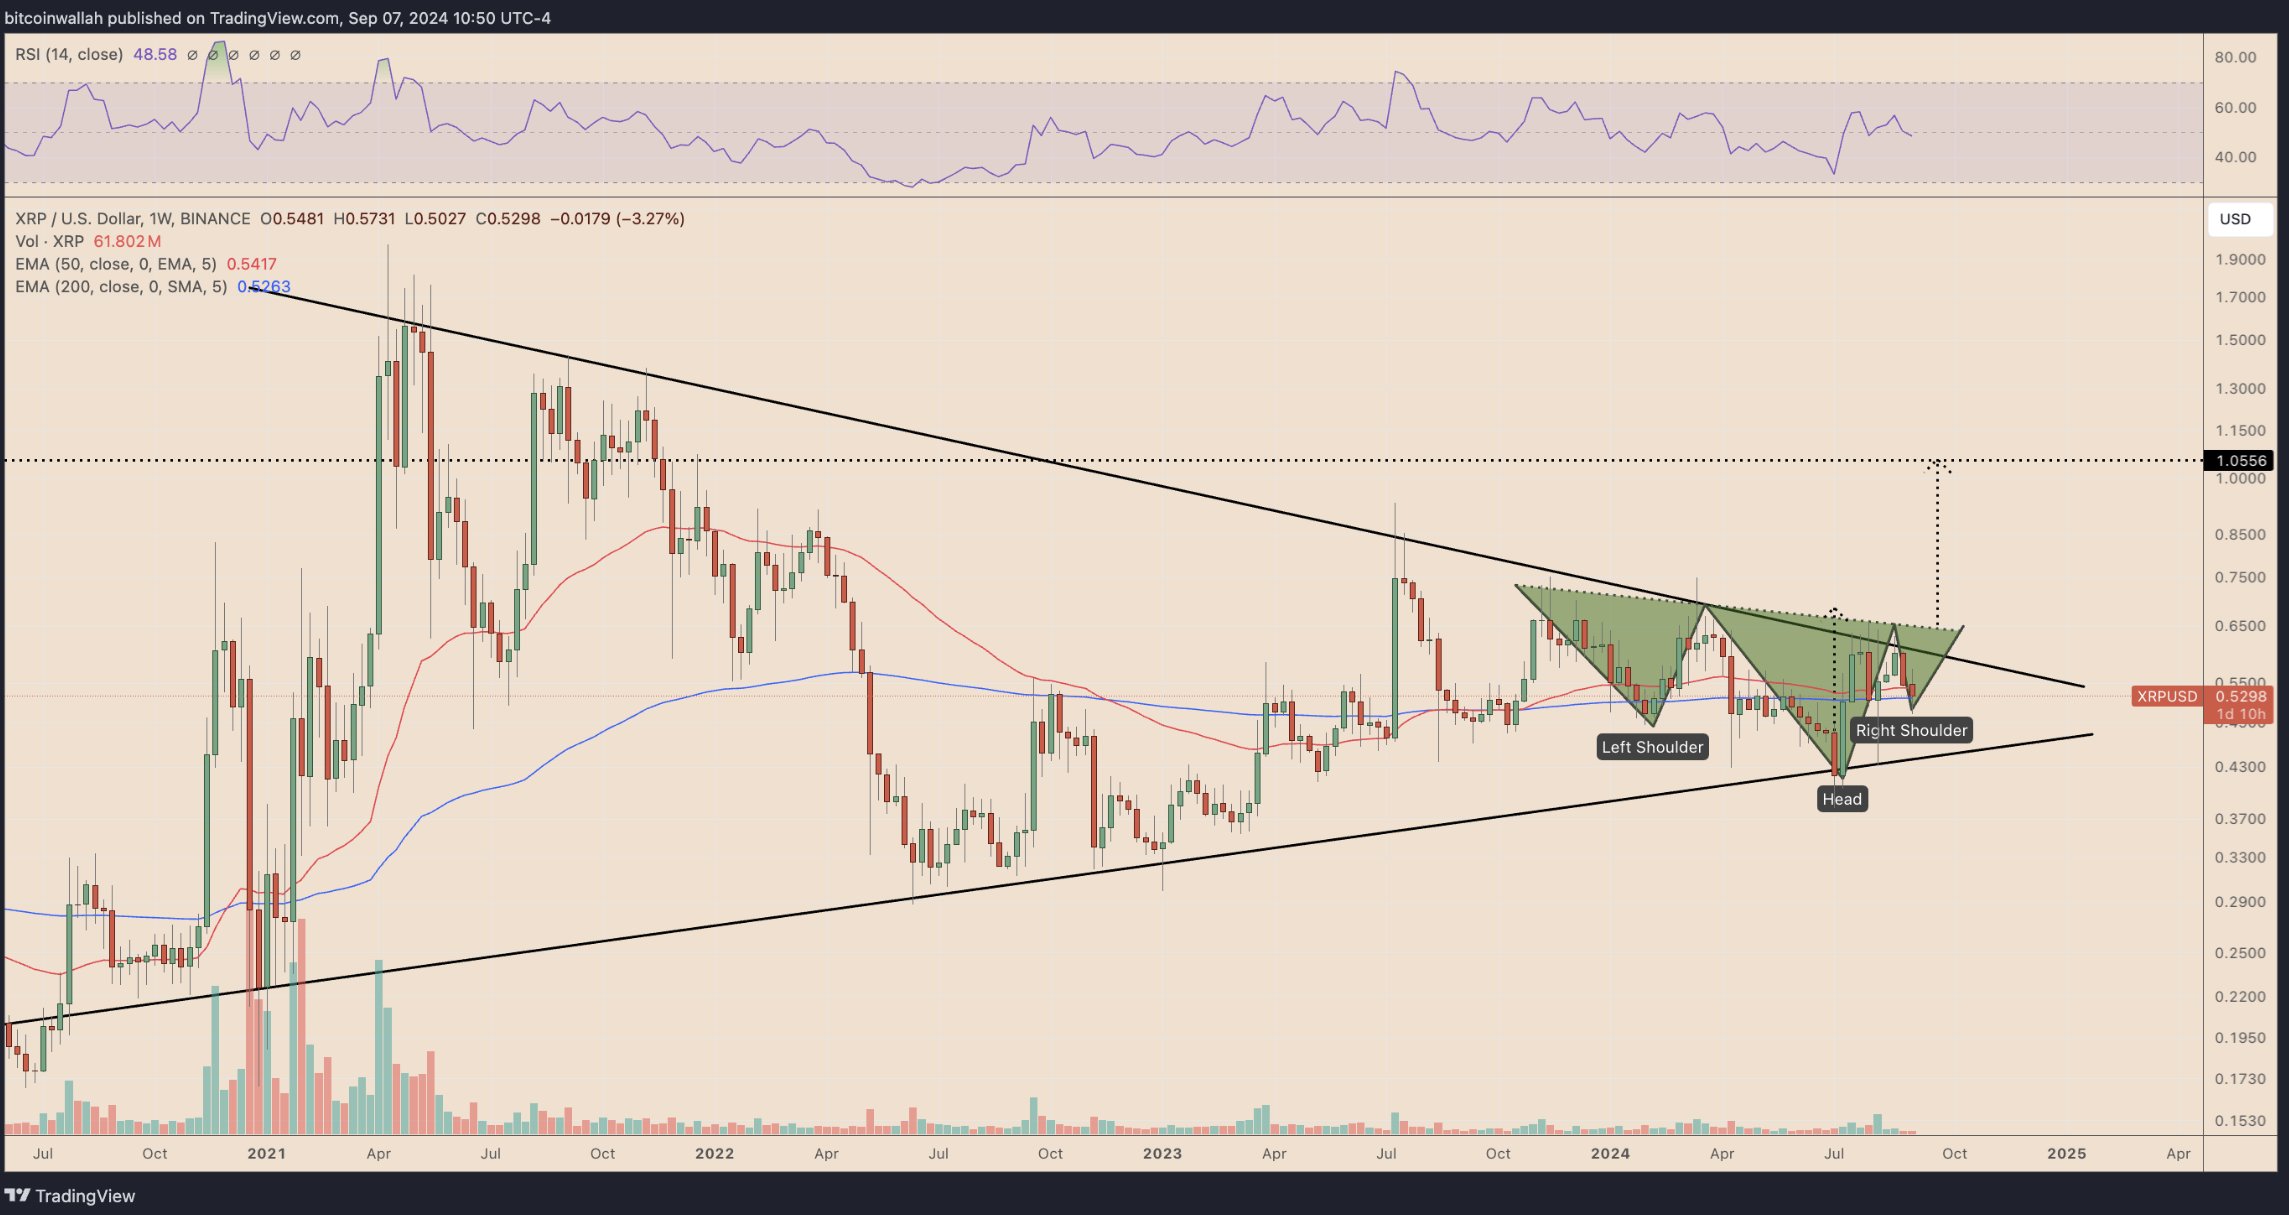

Accordingly, the analysis identified key levels for traders to watch: the neckline of this pattern, located around $0.65 to $0.66. This is a trendline connecting the shoulders and head heights.
A breakout above this resistance could propel XRP toward the $0.90 to $1.00 range. This milestone will result in a return of over 90% from XRP purchased today at $0.526. Notably, the analysis highlighted that this target is attainable before 2024 ends.
Adding to the bullish case, XRP is currently trading above both its 50-week and 200-week exponential moving averages.
Symmetrical Triangle on Monthly Chart Hints at $4.20
Zooming to the monthly chart, XRP also forms a symmetrical triangle pattern. Per the analysis, if the upper trendline of this triangle is broken, XRP could surge toward a target of $4.20 or higher based on long-term technical projections.
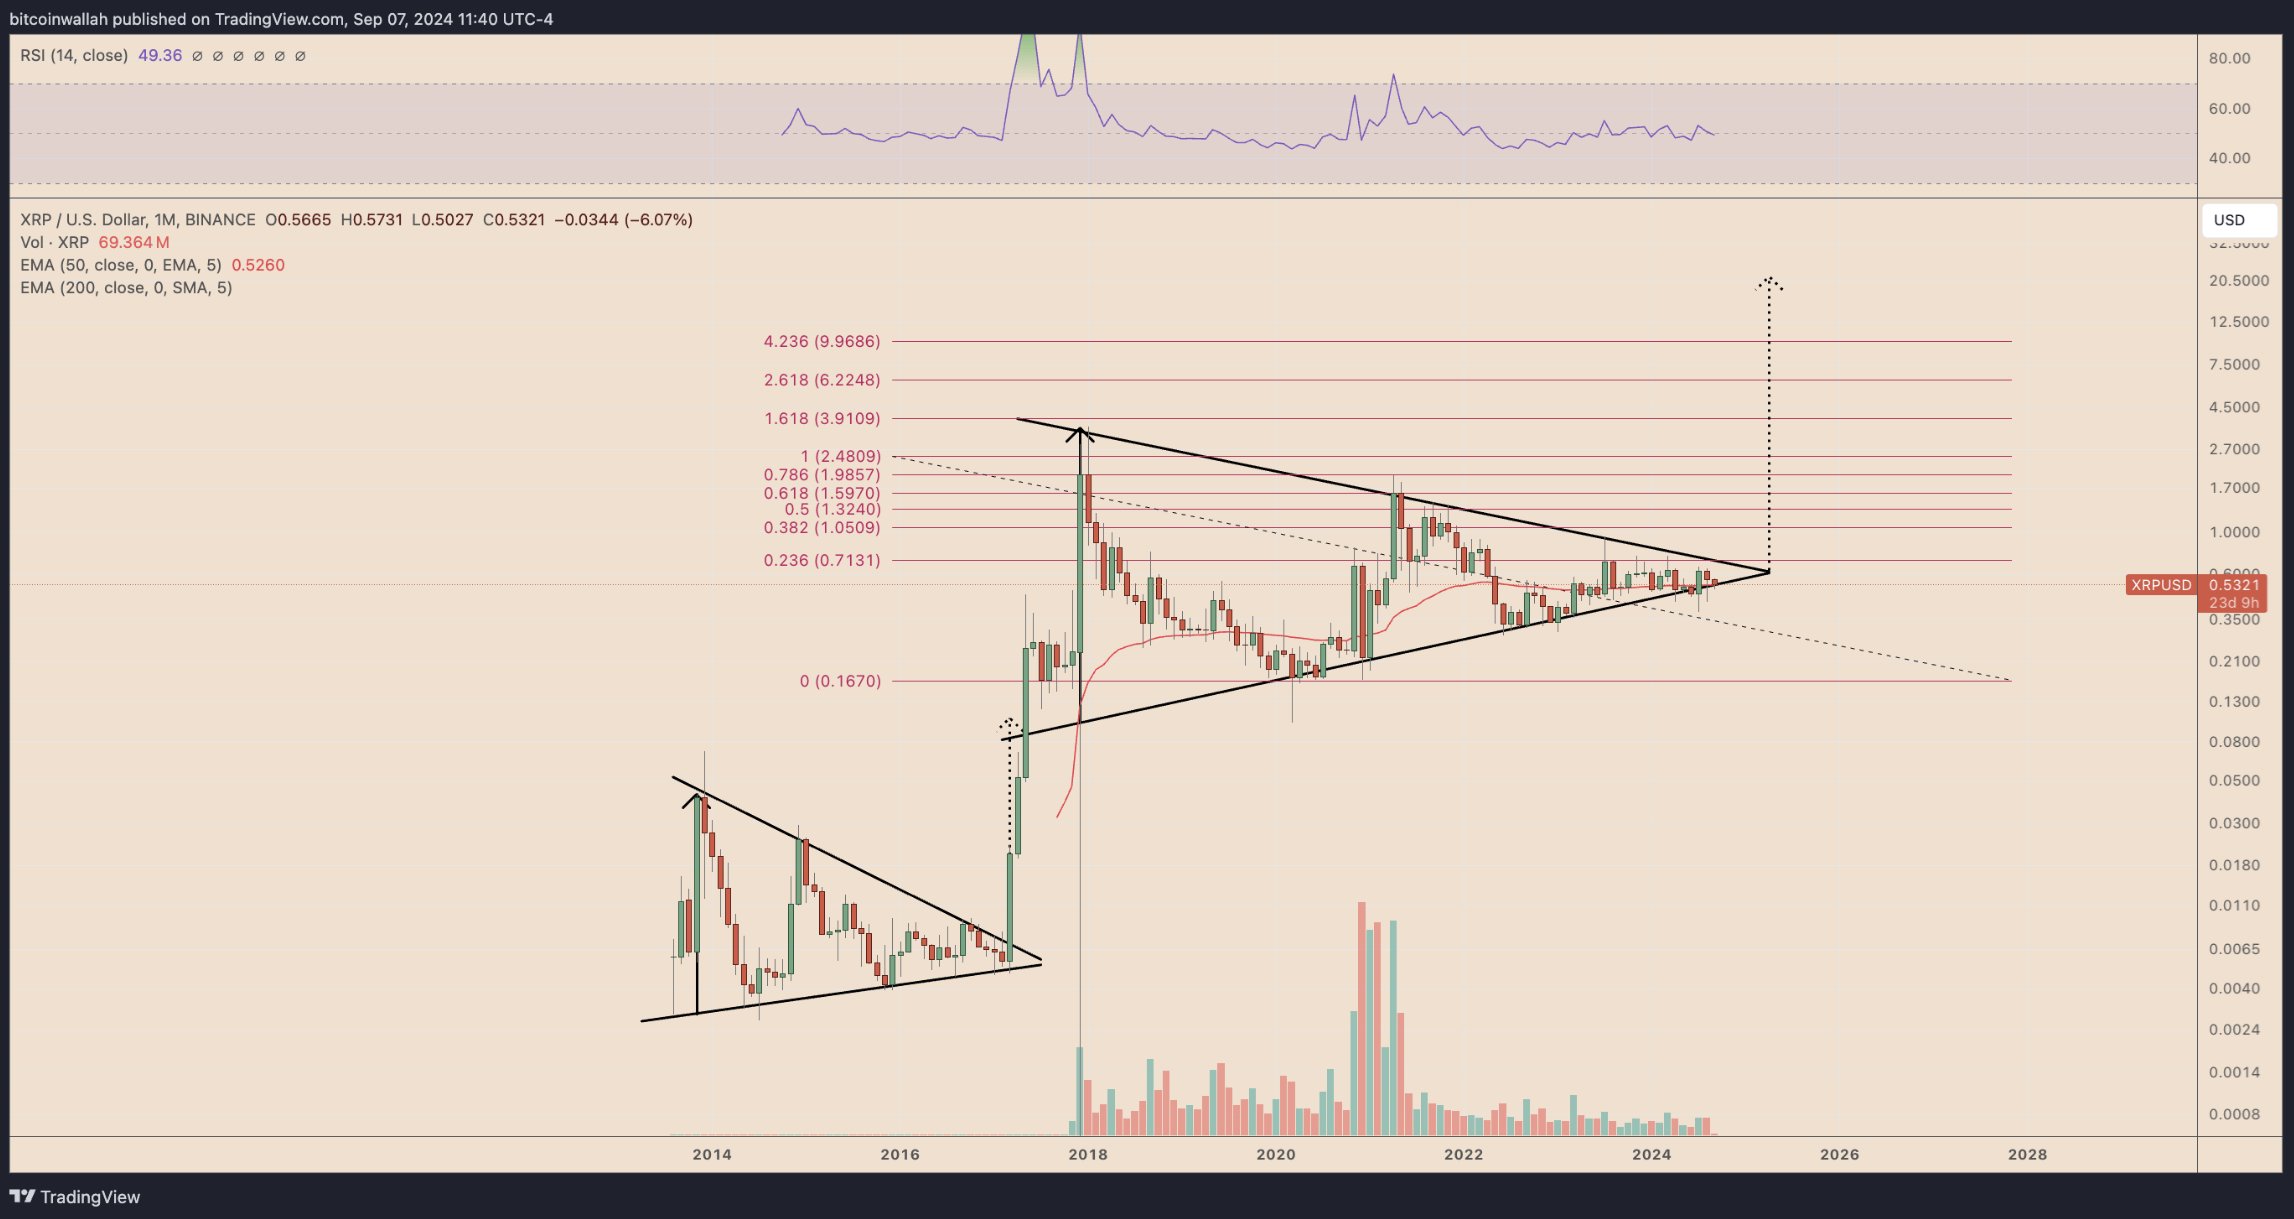
However, before this level is in play, XRP faces immediate resistance in the $0.71 to $1.05 range, which coincides with the 0.236-0.382 Fibonacci retracement levels. This zone aligns with the IH&S target, suggesting that a major rally could unfold if XRP breaks above these levels.
Community Reacts
Commenting on the analysis, Zach Humphries, a notable voice in the XRP community, expressed that XRP offers a strong opportunity both in the short and long term at its current price point. He stressed that XRP shows significant upside potential near or just under $0.50.
In previous analyses, some market observers have speculated that XRP could reach as high as $300 following a breakout from the long-term resistance. However, such projections are often resisted, with many considering them overly optimistic.
The latest analysis, which suggests a more modest long-term target of $4.20, aligns with a growing consensus that this range is more achievable for XRP. Notably, reaching $4.20 requires XRP to advance by over 692% or expand by 7X.
Disclaimer: This content is informational and should not be considered financial advice. The views expressed in this article may include the author’s personal opinions and do not reflect The Crypto Basic’s opinion. Readers are encouraged to do thorough research before making any investment decisions. The Crypto Basic is not responsible for any financial losses.
Source: https://thecryptobasic.com/2024/09/09/xrp-set-to-surge-692-latest-technical-analysis-predicts-rise-to-4-20/?utm_source=rss&utm_medium=rss&utm_campaign=xrp-set-to-surge-692-latest-technical-analysis-predicts-rise-to-4-20